Detailed Climate Information for Canada: Regional Weather Patterns and Data
Canada, known for its diverse landscapes and vast wilderness, experiences a variety of climates across its provinces and territories.
Canada's climate varies from arctic in the north to temperate in the south. The coastal regions experience milder temperatures due to ocean influences, while the interior provinces have more extreme temperature ranges.
Best Travel Time Guide for Canada: Ideal Seasons and Weather Insights
The best time to travel to Canada varies depending on the region. Summer is ideal for outdoor activities in most provinces, while winter sports enthusiasts will enjoy the snowy landscapes in the northern regions.
Detailed Climate in the Regions of Canada
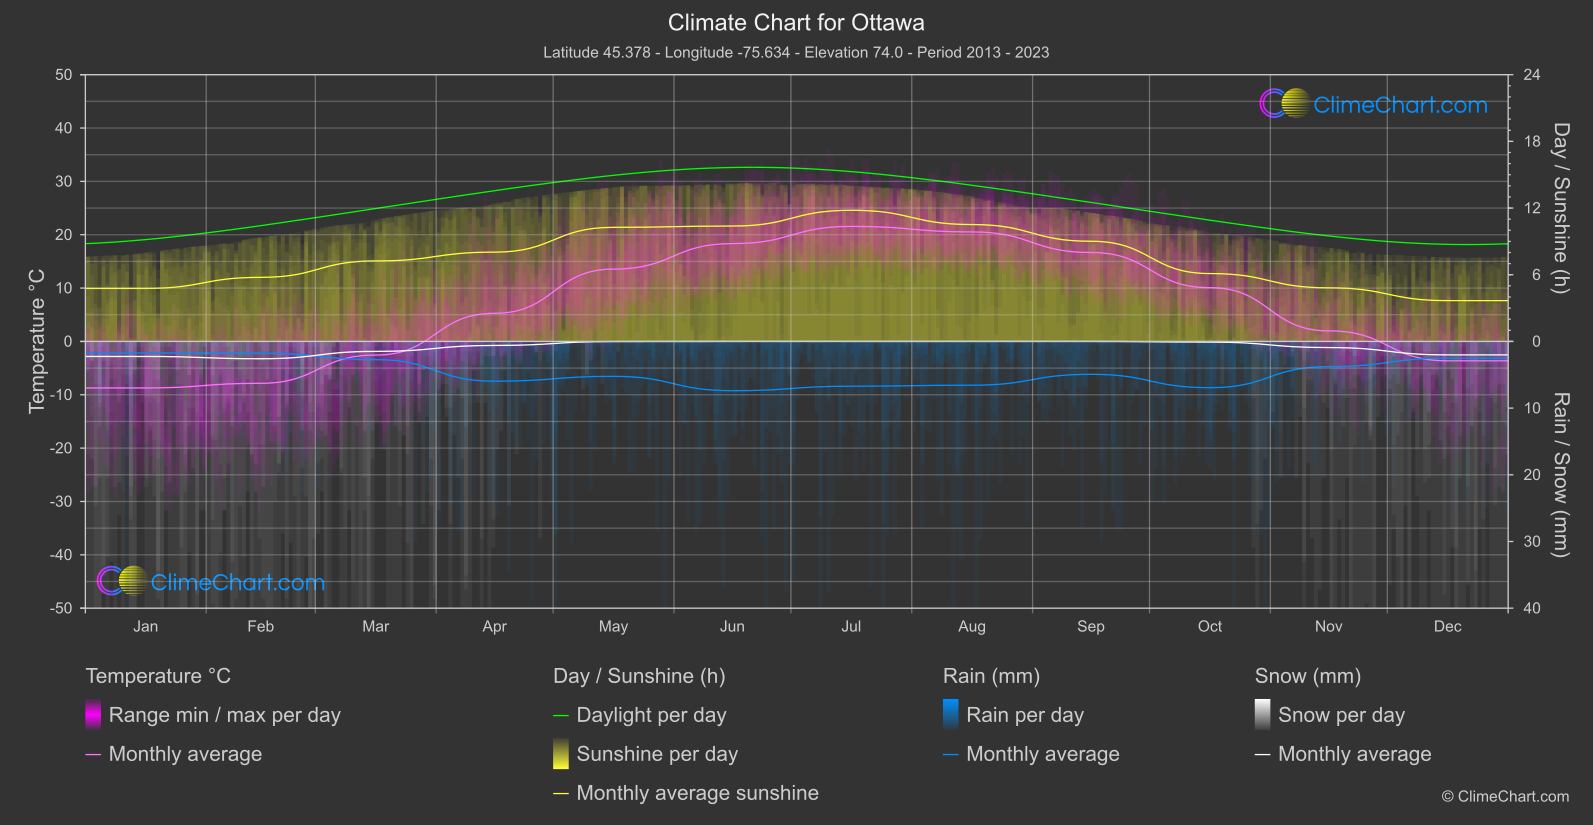
Ottawa
Region South-East
January has the lowest monthly mean temperature, -8.
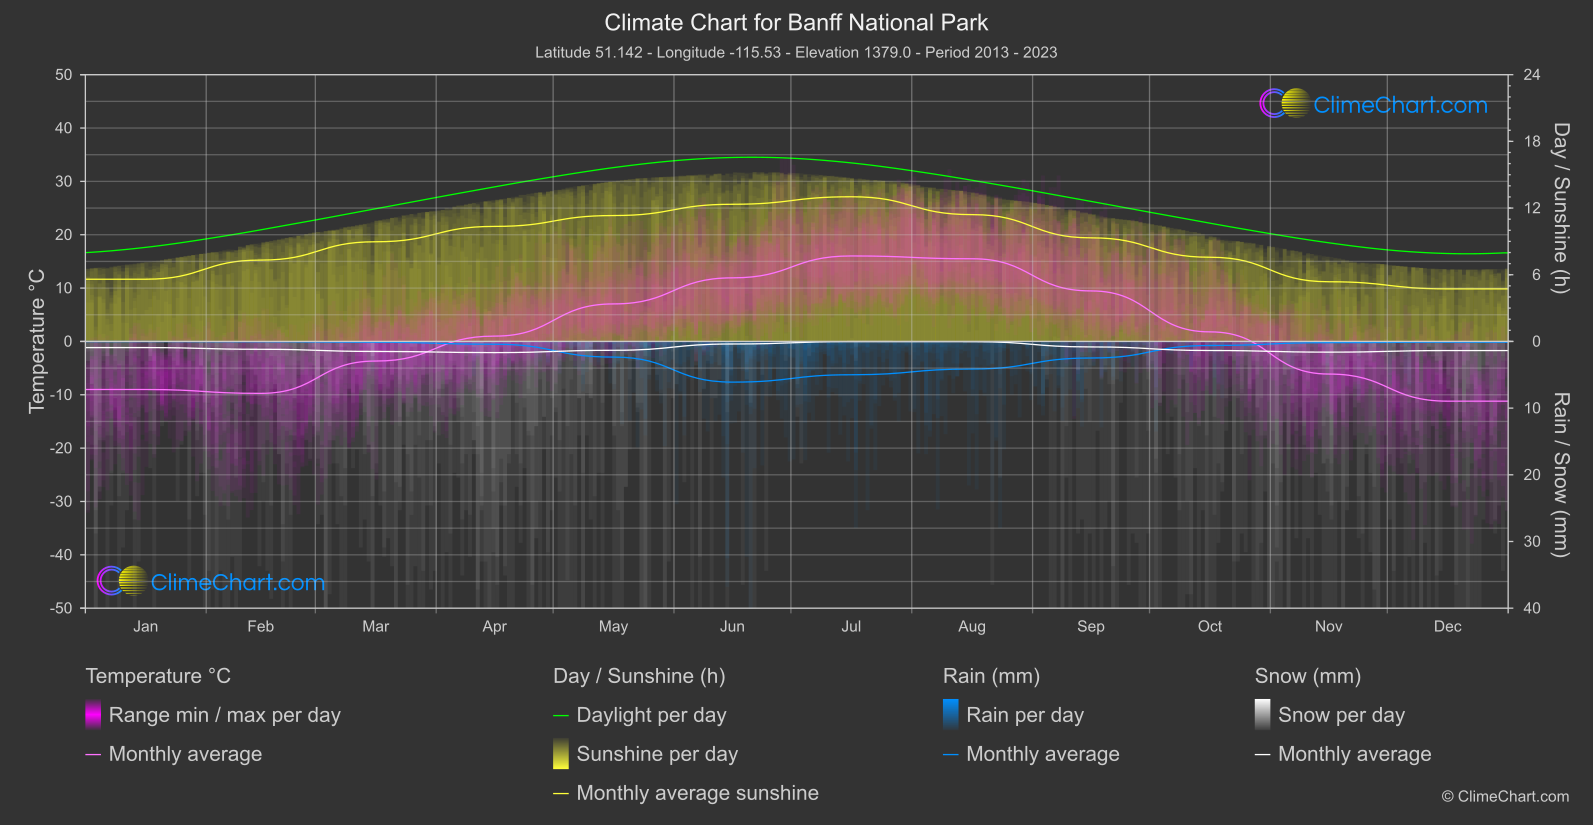
Banff National Park
The monthly mean temperature is warmest in July, at 16.
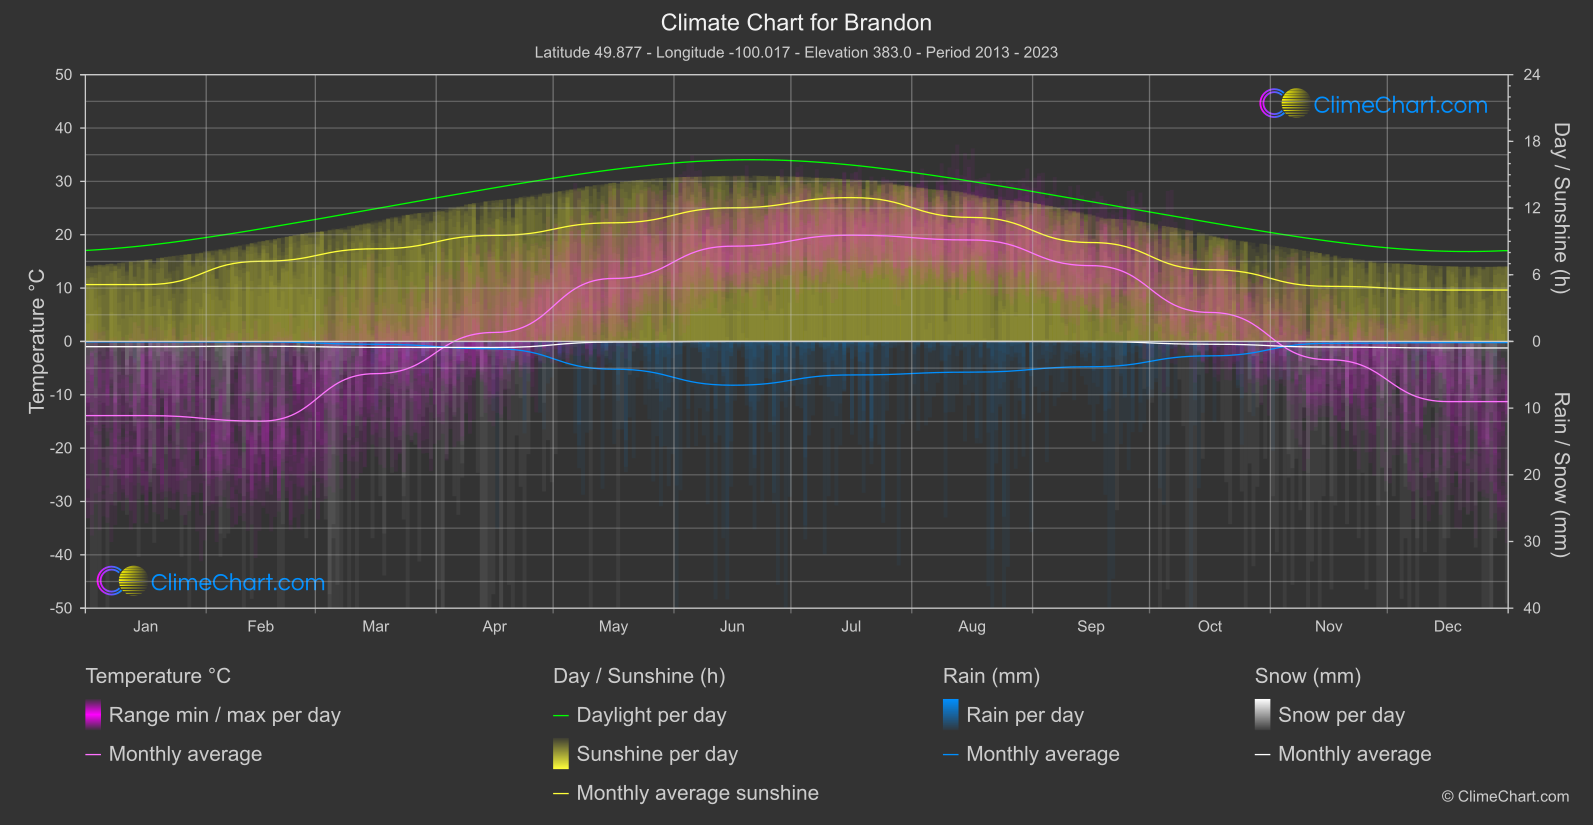
Brandon
February has the lowest monthly mean temperature, at -14.
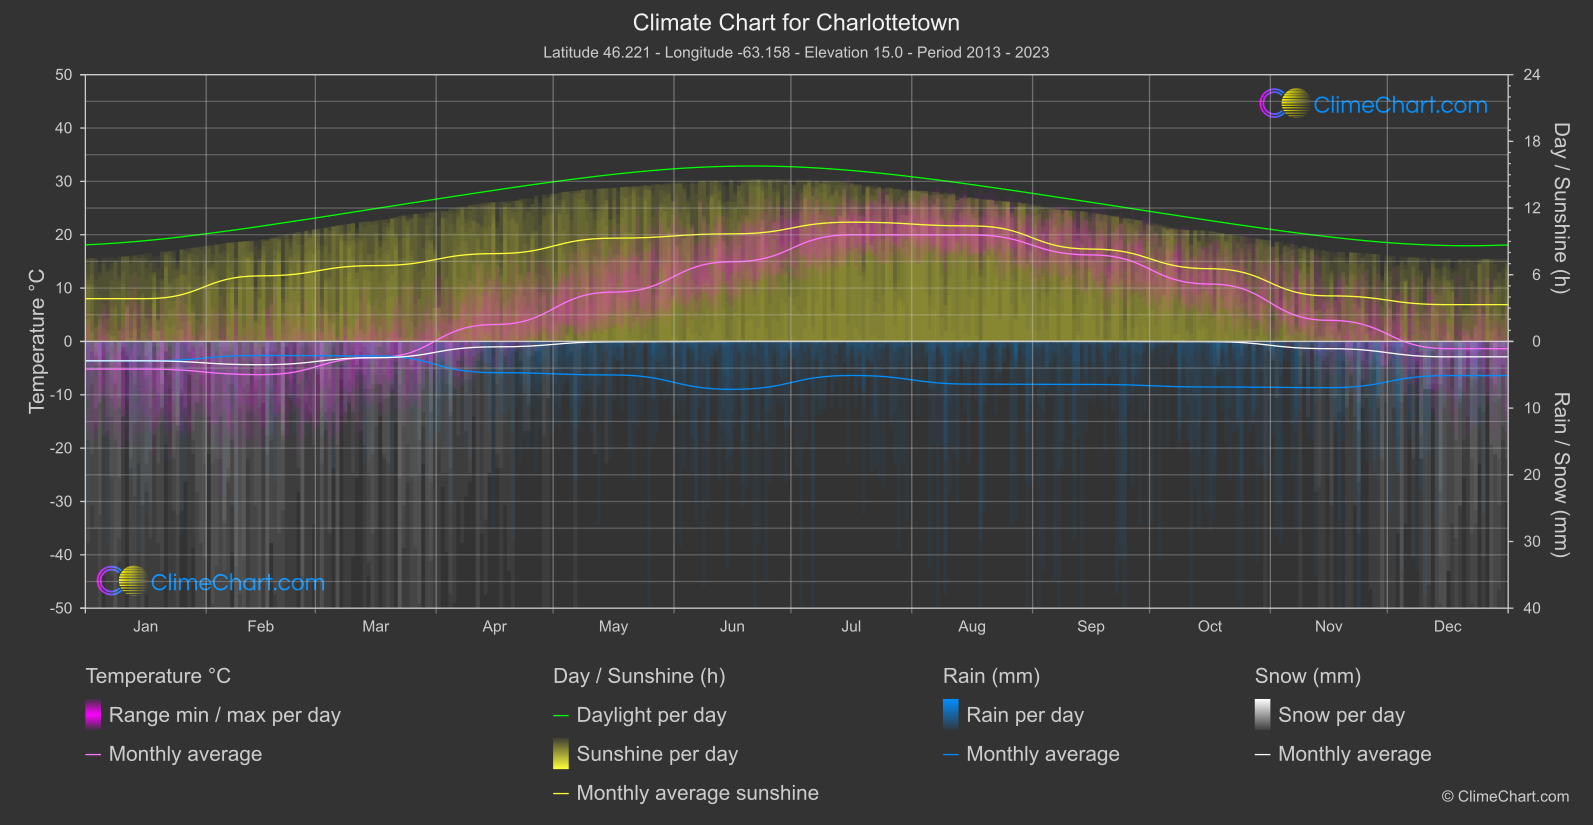
Charlottetown
Monthly mean temperatures are highest in July / August at 20.
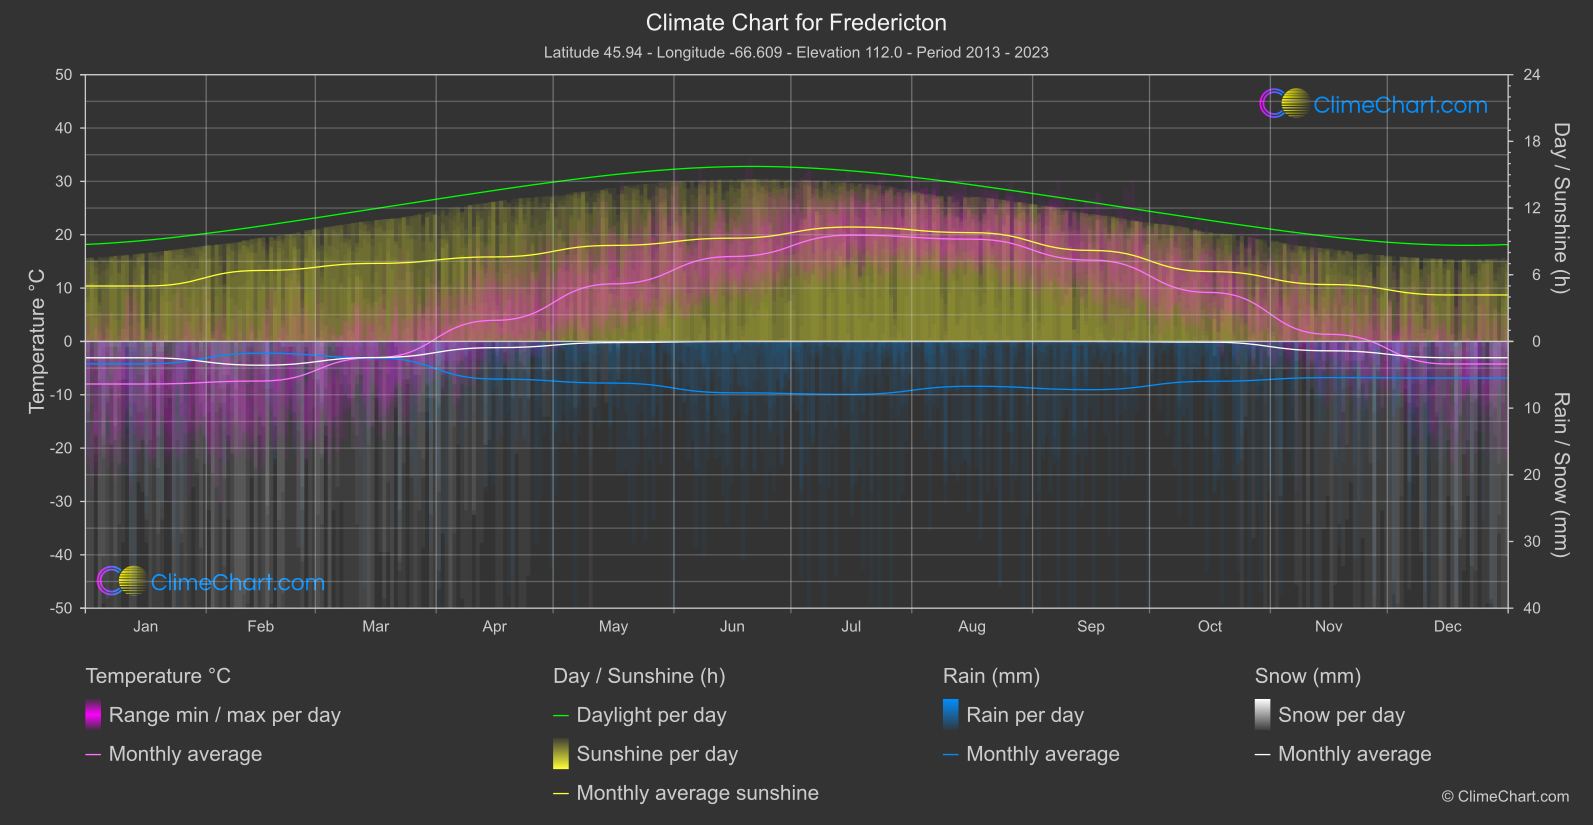
Fredericton
January has the lowest monthly mean temperature, -8.
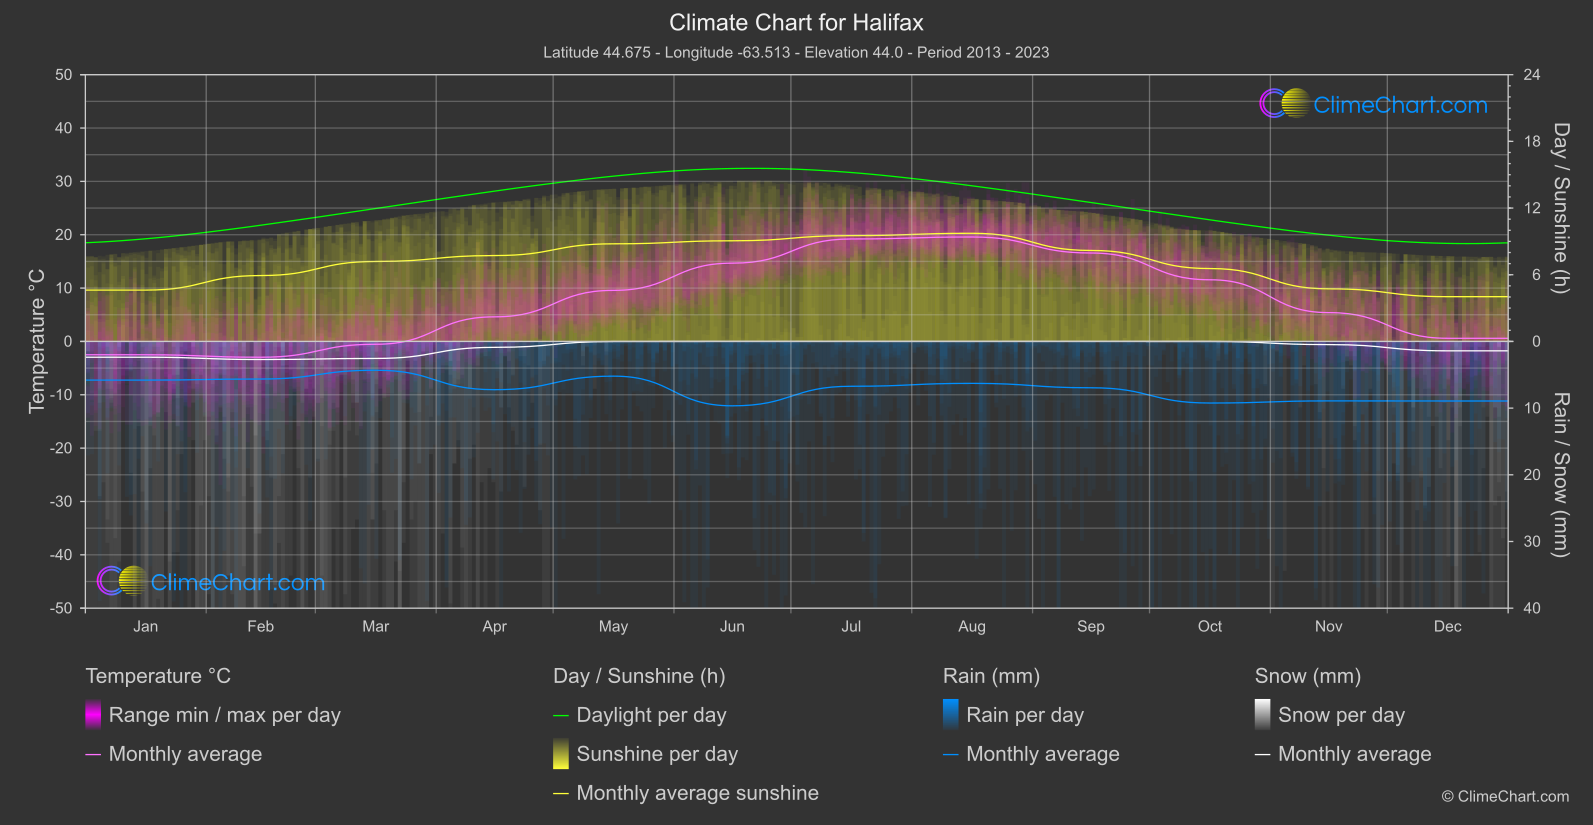
Halifax
Monthly mean temperatures reach their lowest point in February, at -3.
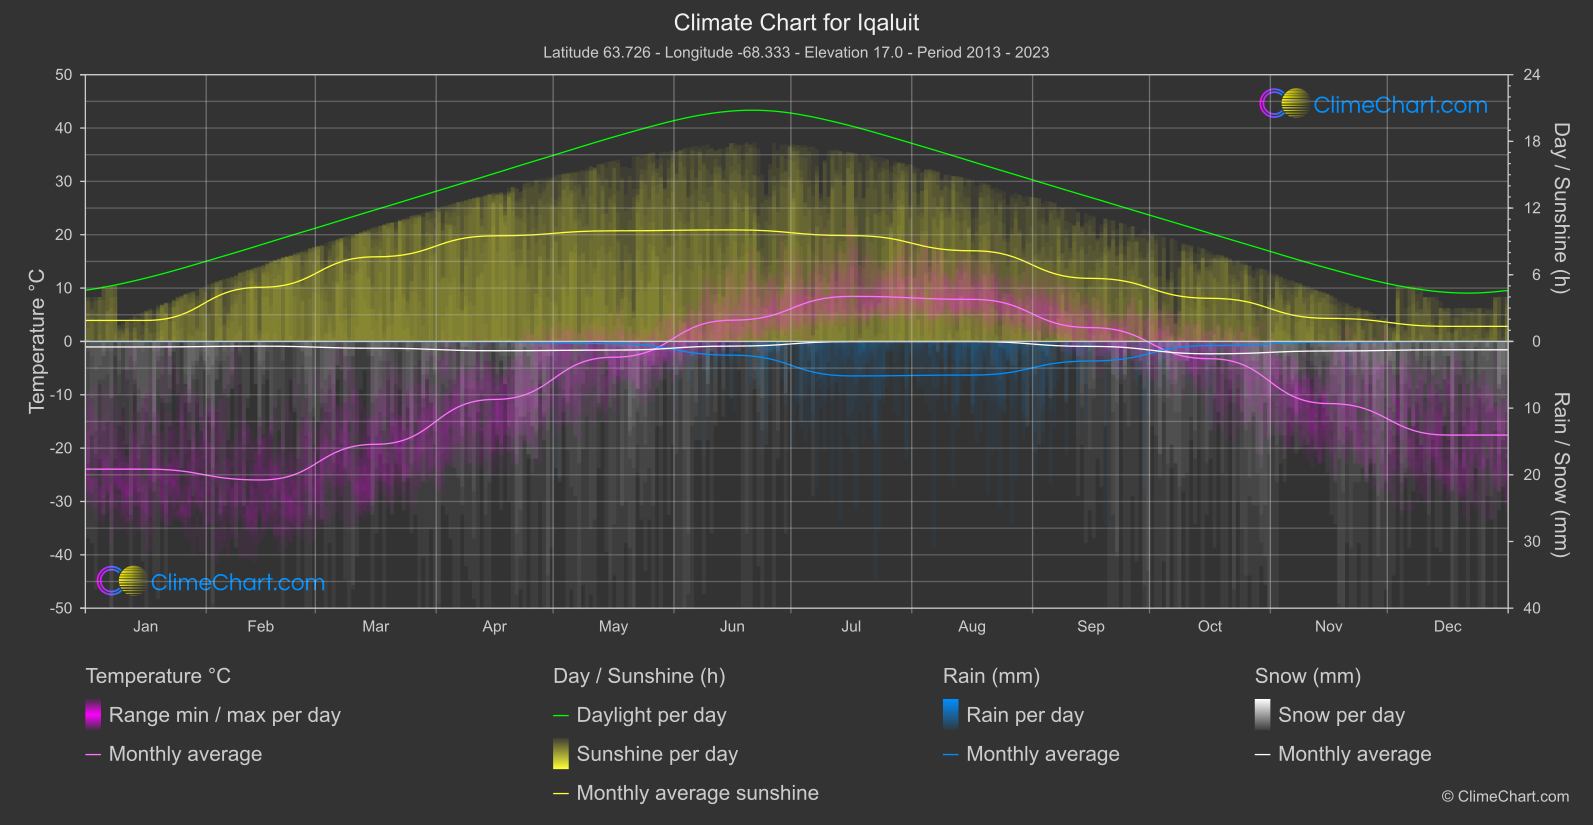
Iqaluit
Iqaluit, the capital of Nunavut in Canada, experiences a polar climate with long, cold winters and short, cool summers.
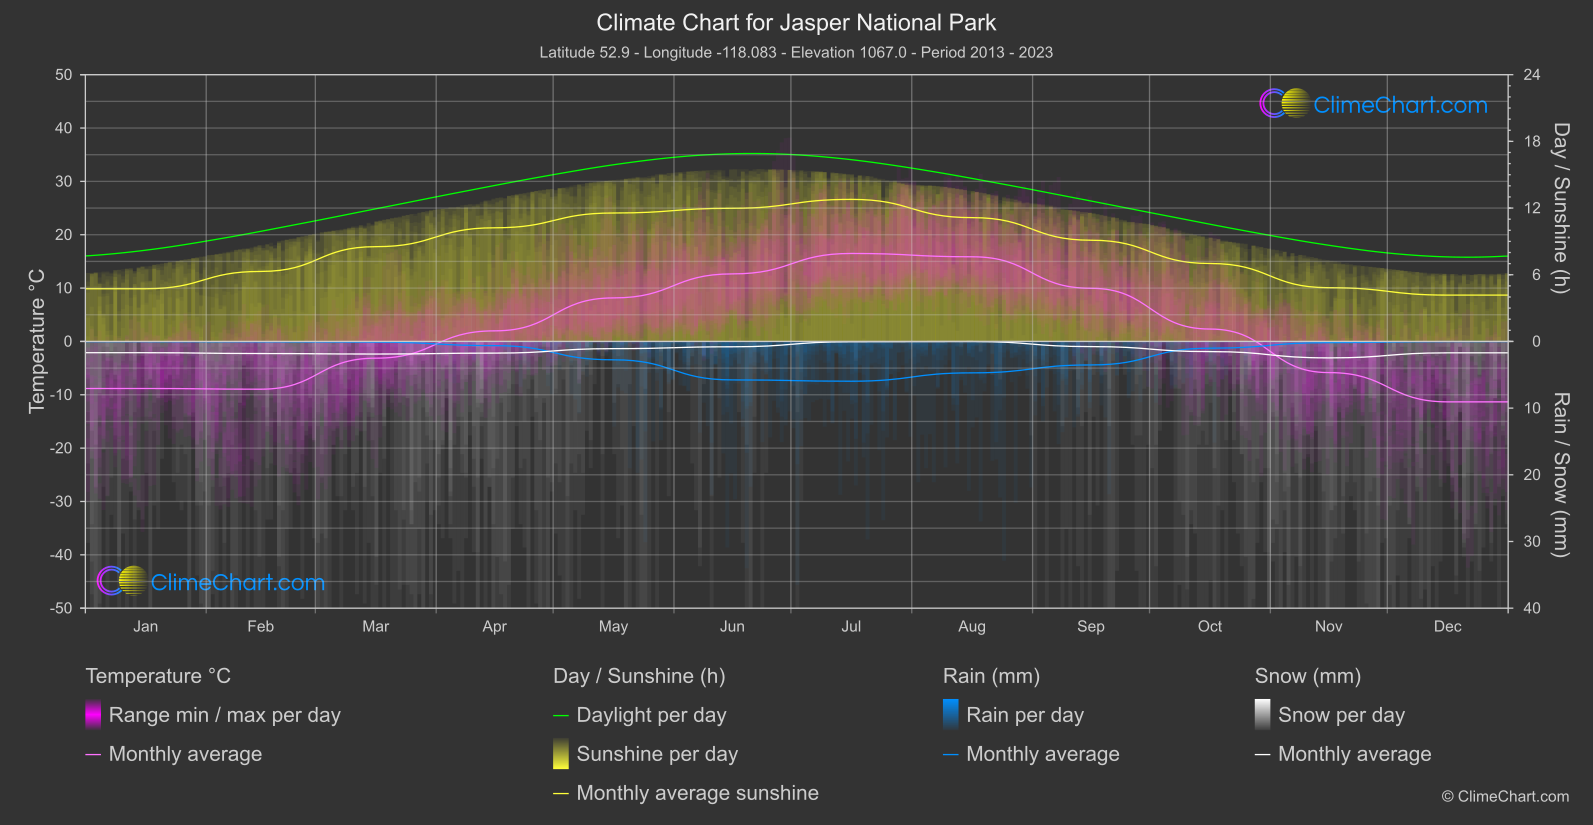
Jasper National Park
Monthly mean temperatures are coolest in December, at -11.
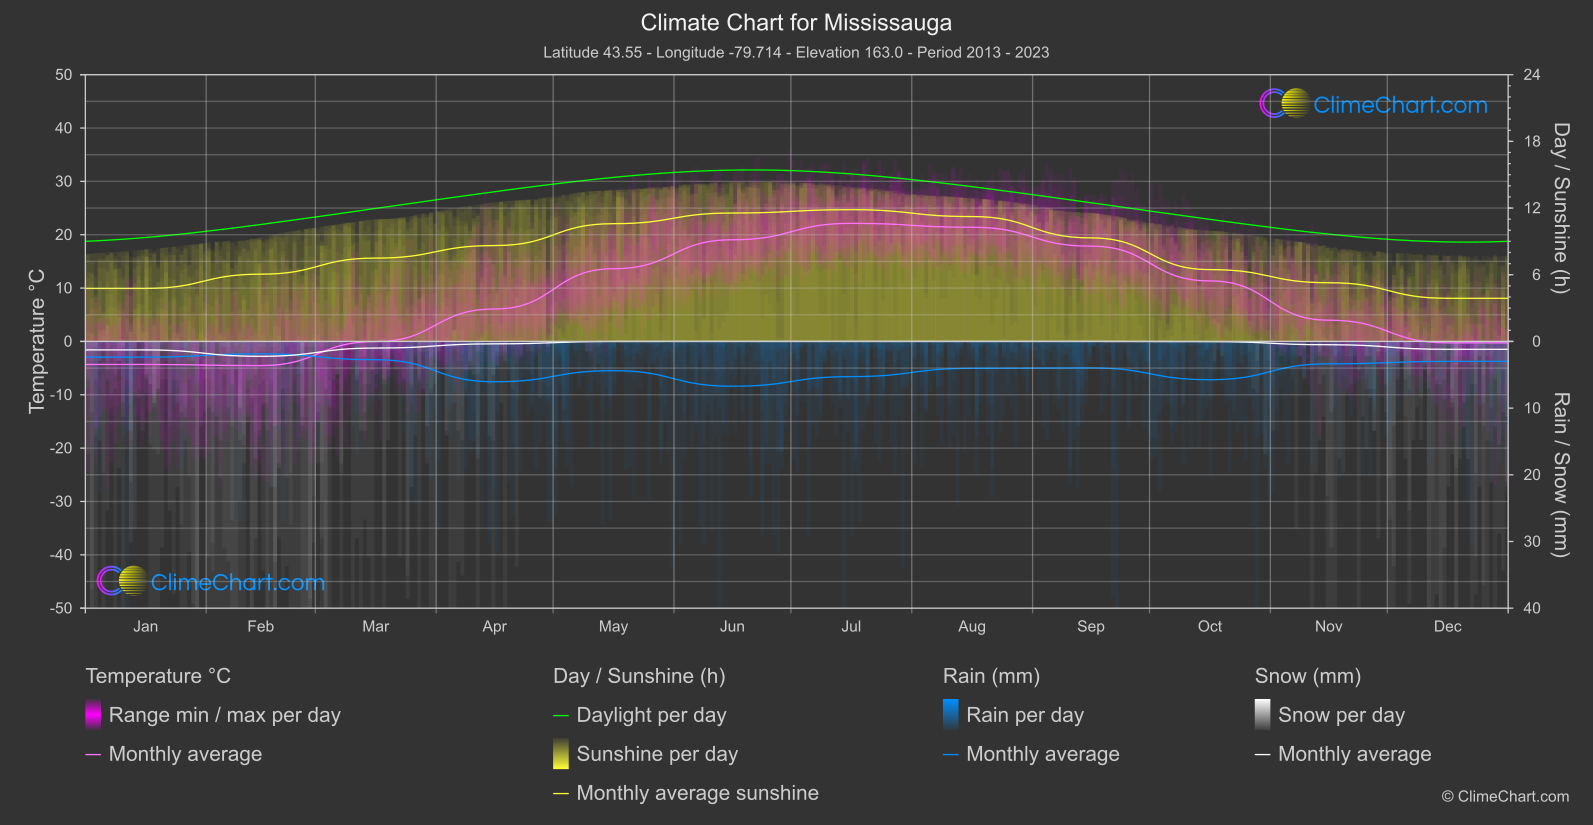
Mississauga
The coolest monthly mean is -4.
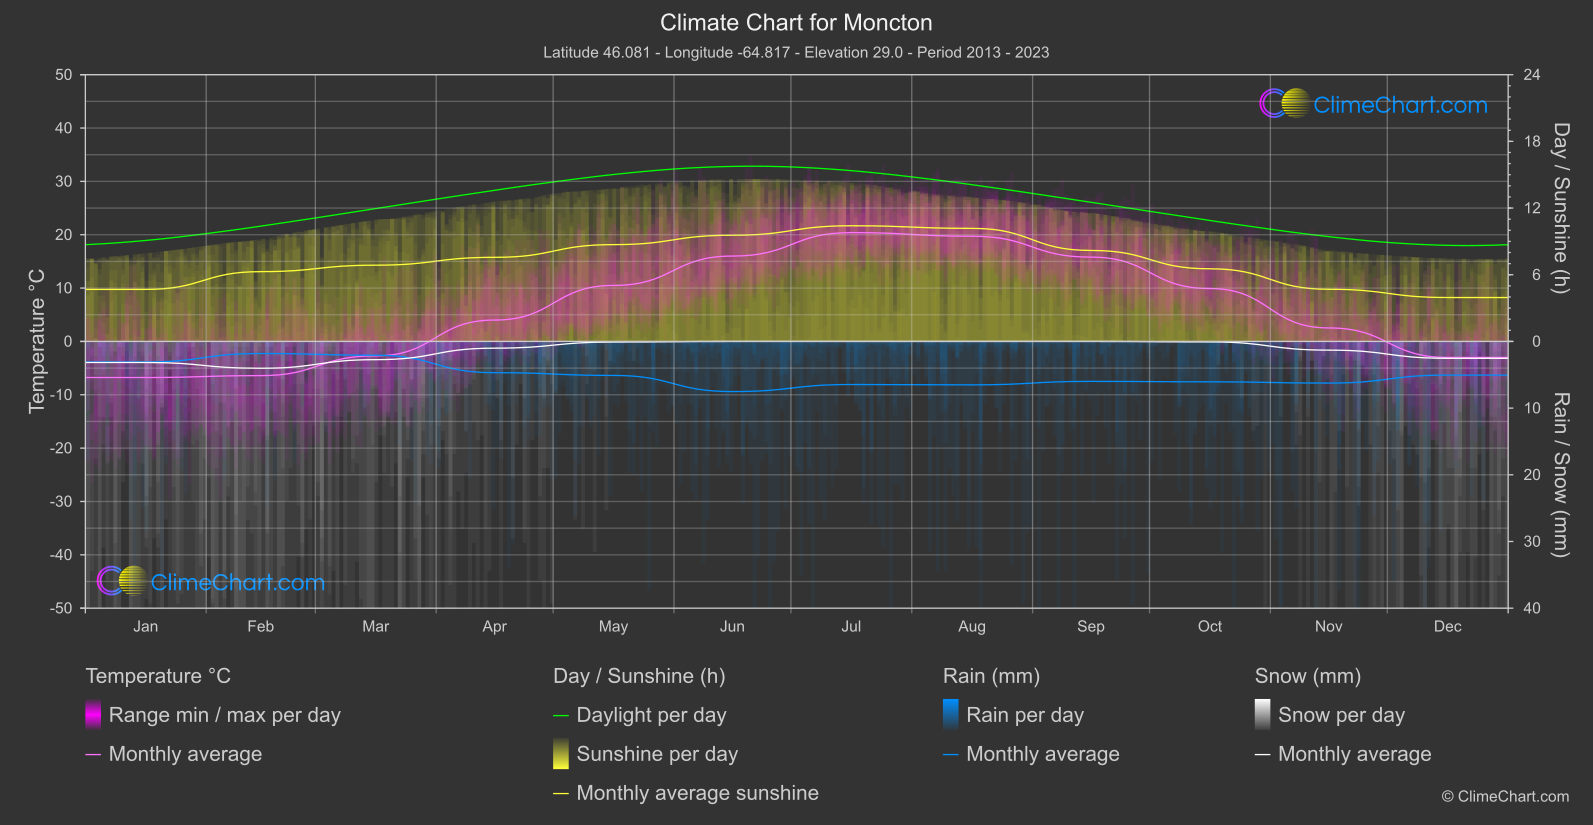
Moncton
Moncton, located in New Brunswick, Canada, experiences a humid continental climate with warm summers and cold, snowy winters.
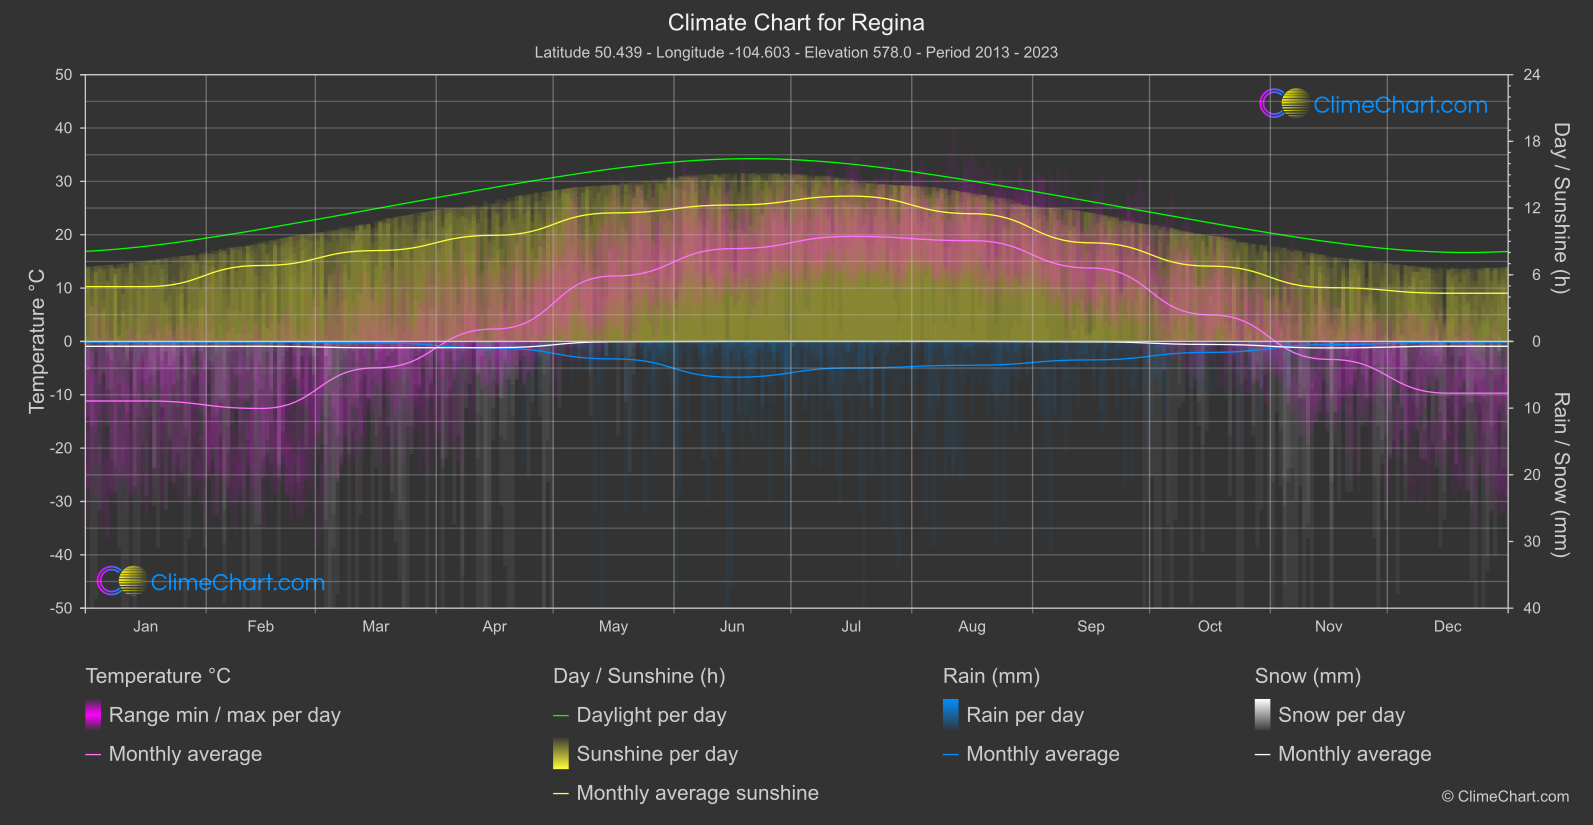
Regina
Monthly mean temperatures reach their highest point at 19.
Saint John
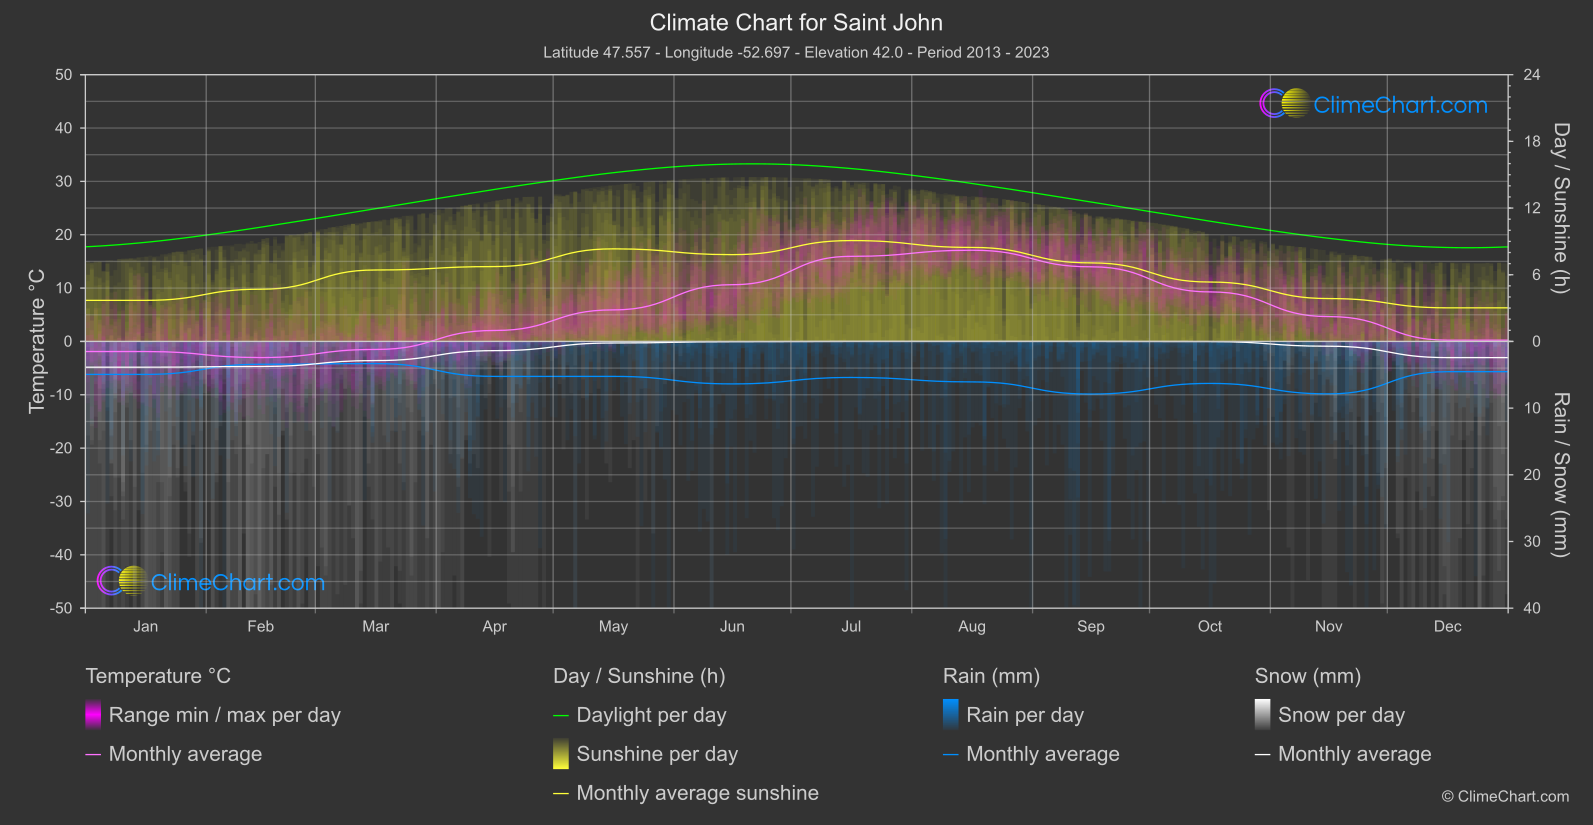
The coolest monthly mean temperature occurs in February, at -3.
Saskatoon
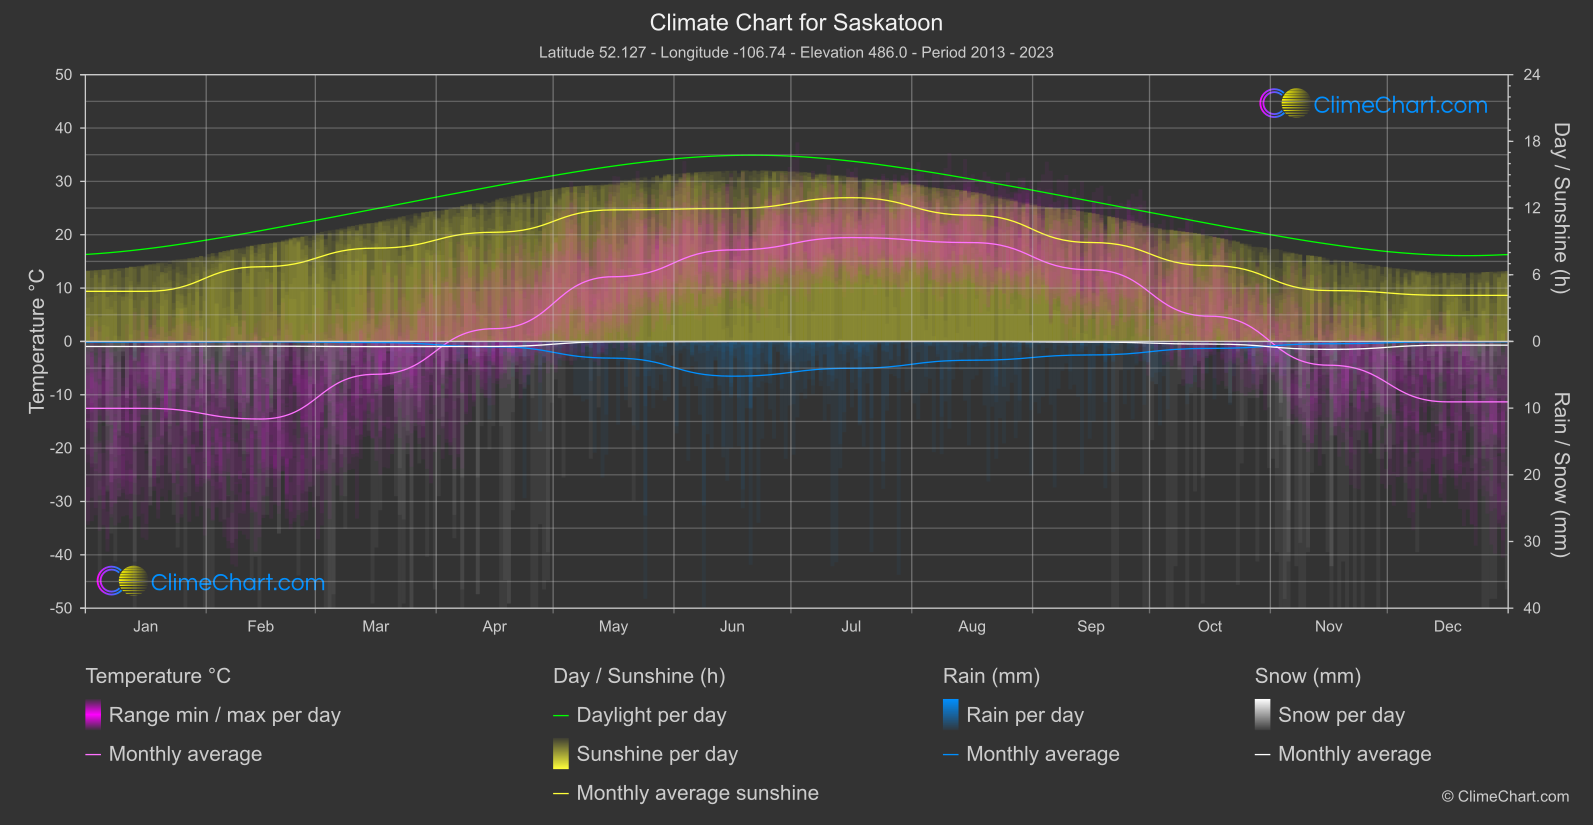
Monthly mean temperatures reach their lowest point in February at -14.
St. John's
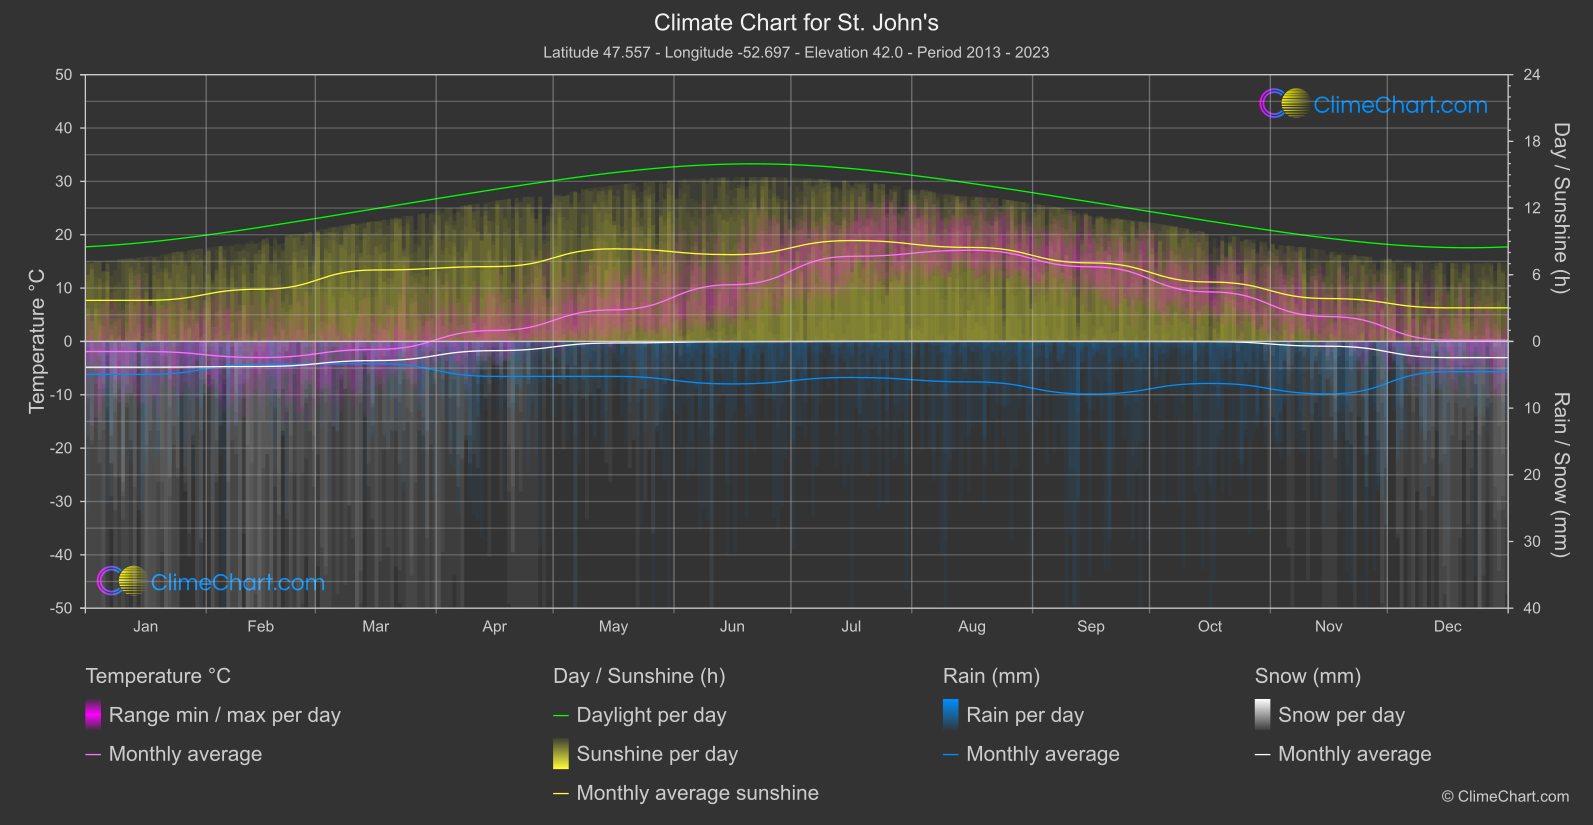
The monthly mean temperature is lowest in February, at -3.
Surrey
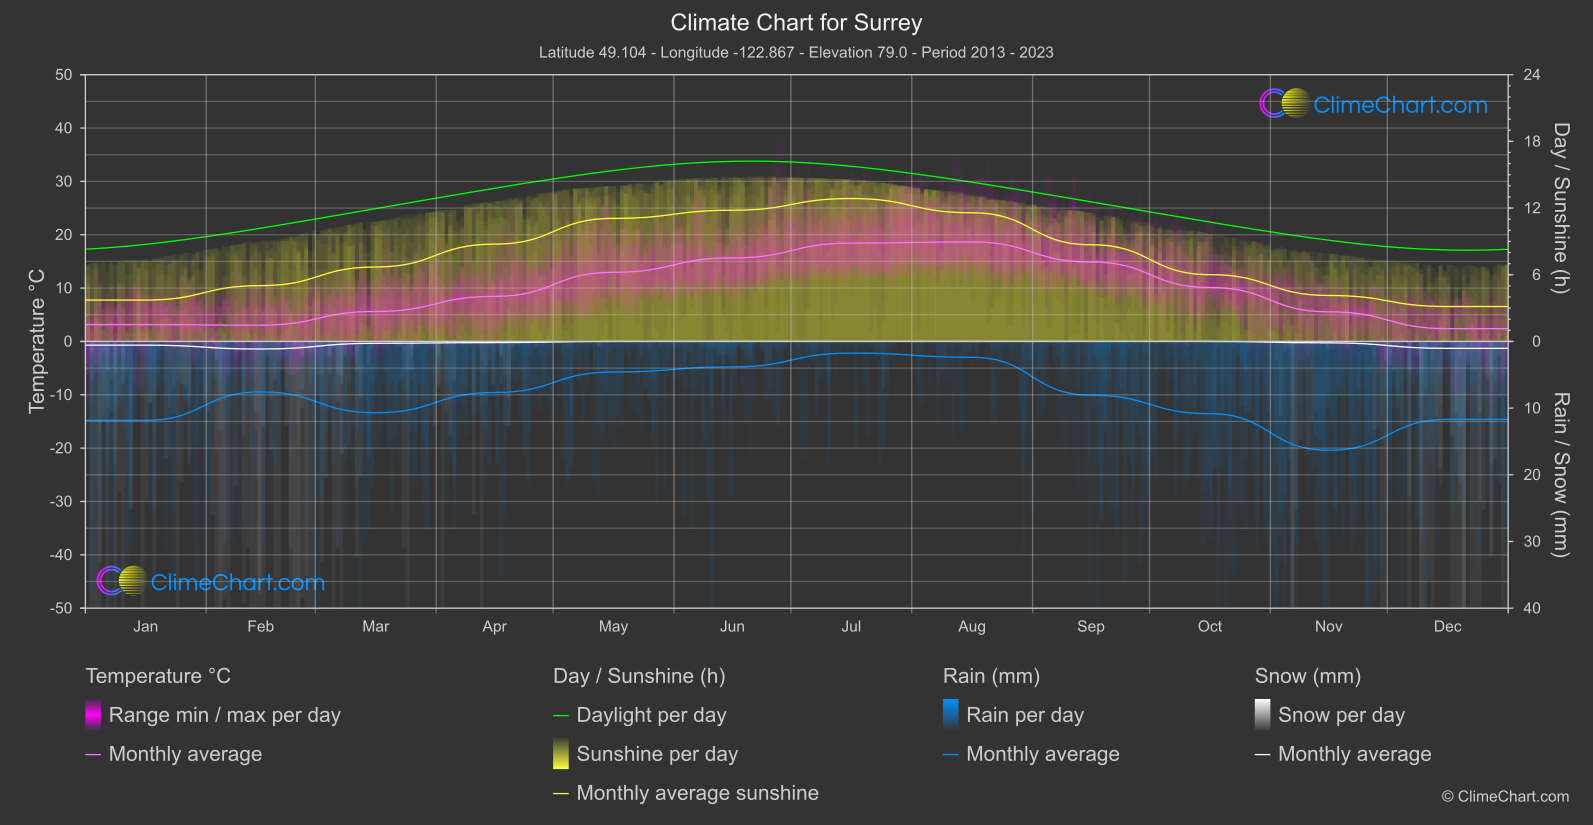
The warmest monthly mean is August at 18.
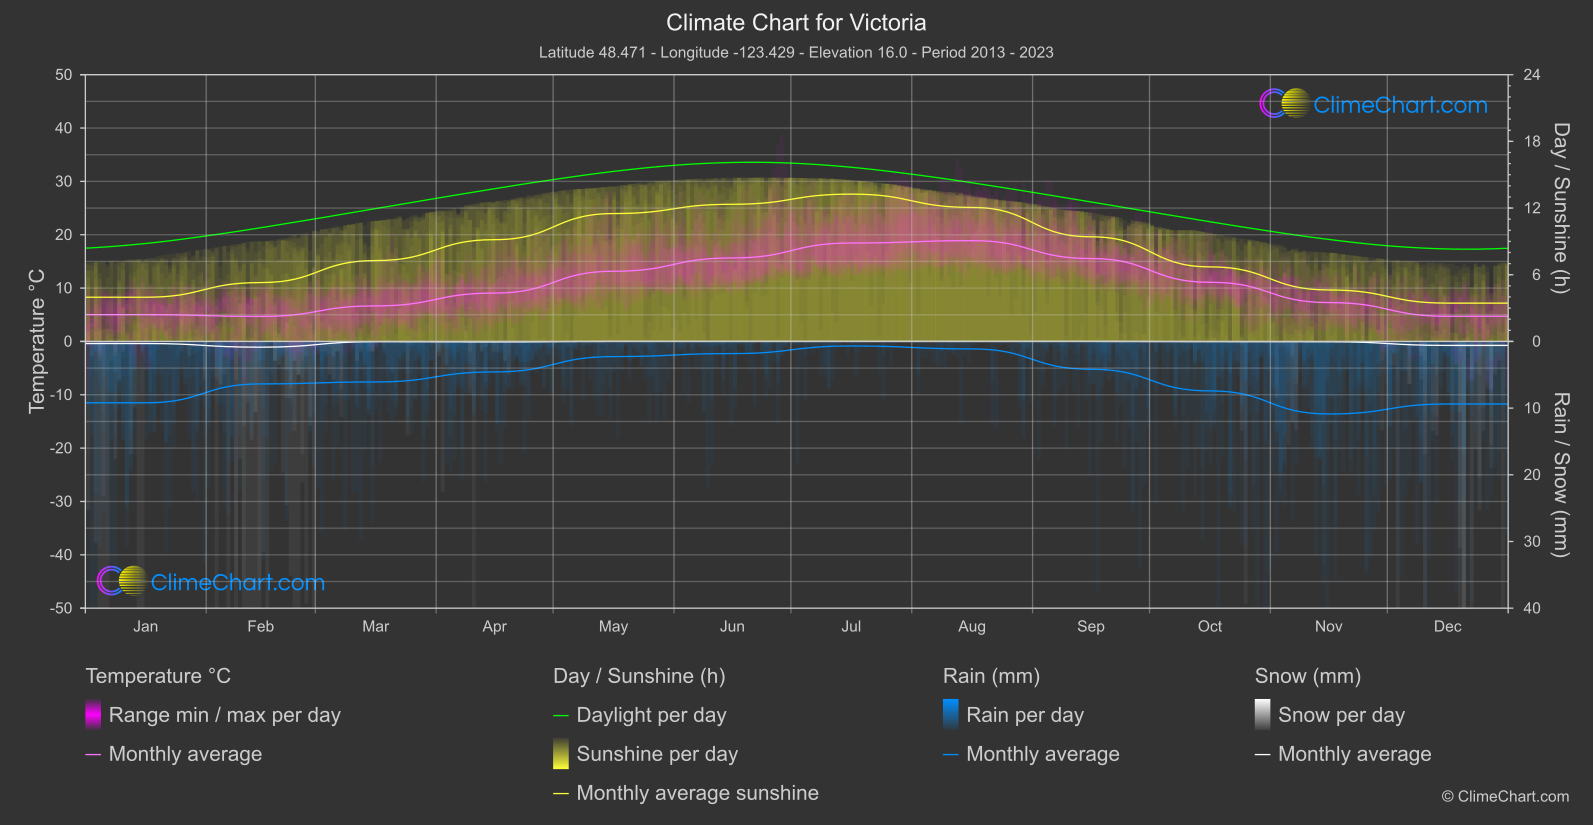
Victoria
Monthly mean temperatures are lowest in February / December, at 4.
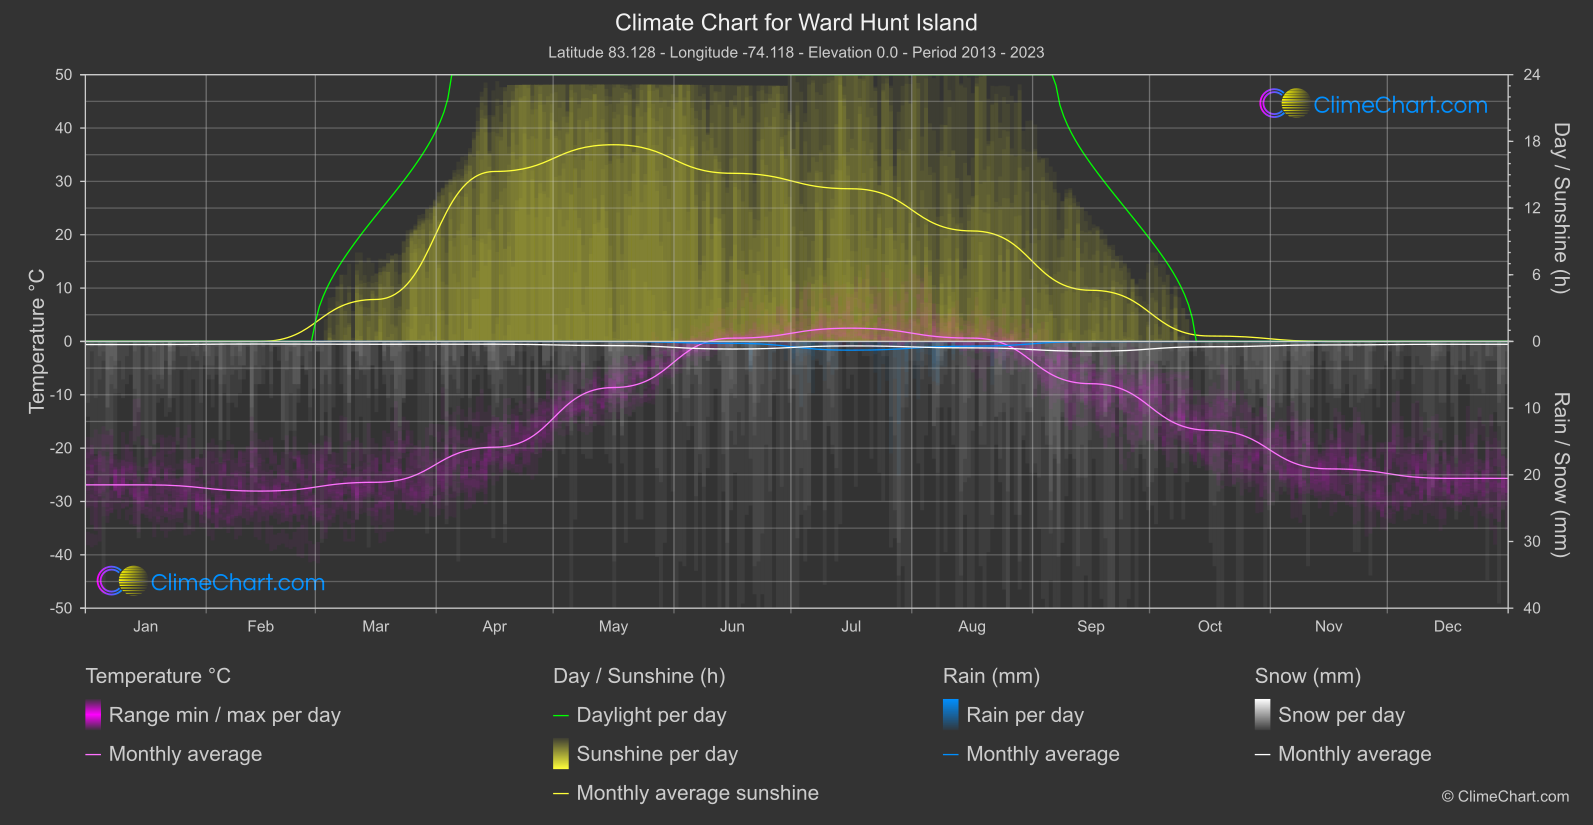
Ward Hunt Island
Ward Hunt Island, located in the Canadian Arctic Archipelago, experiences a harsh Arctic climate characterized by long, cold winters and short, cool summers.
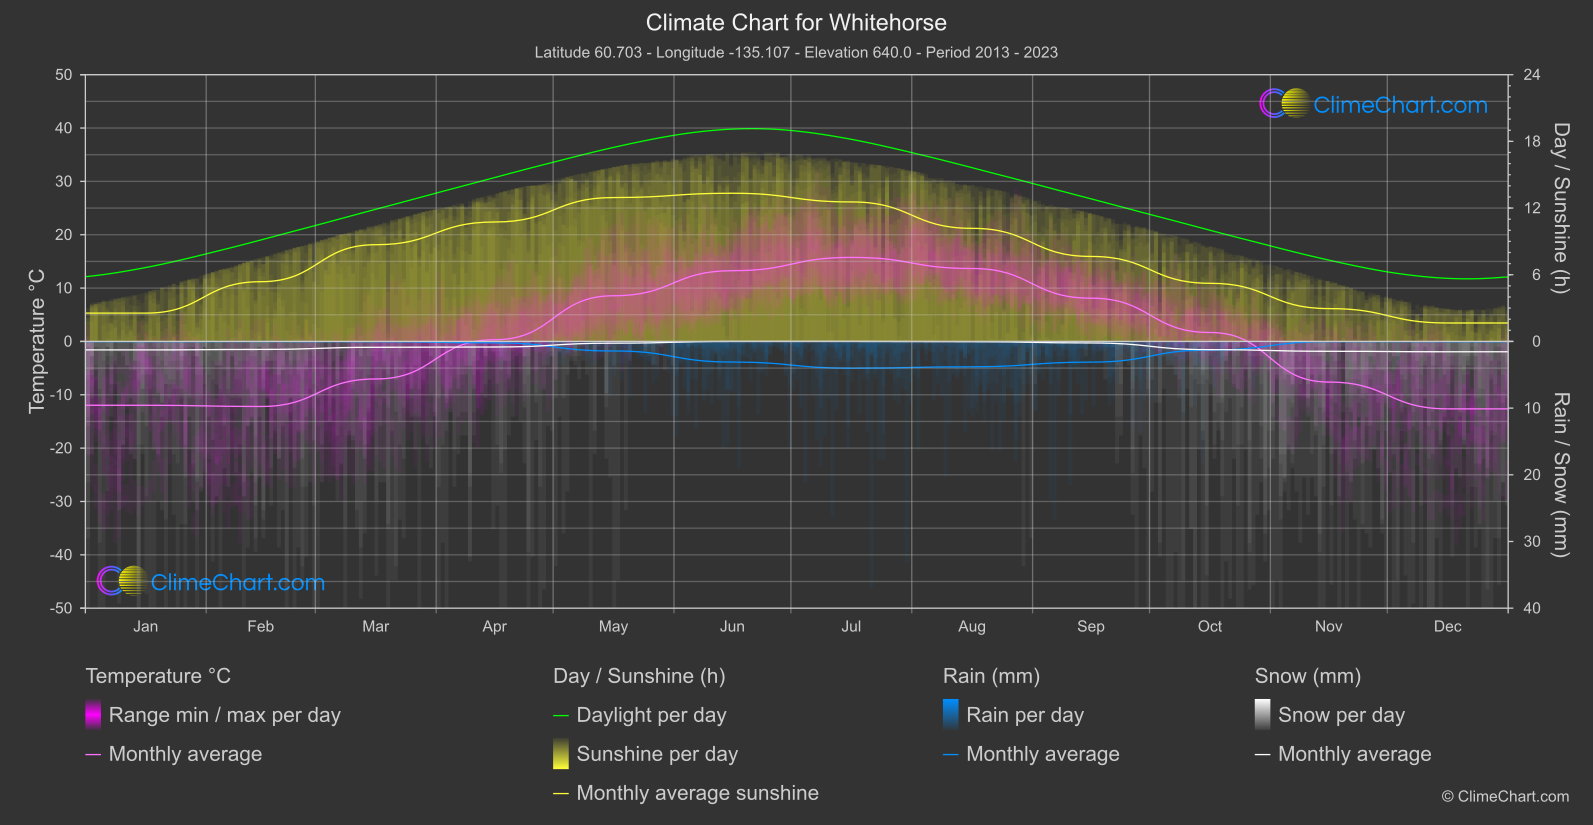
Whitehorse
Whitehorse, the capital of Yukon in Canada, experiences a subarctic climate marked by long, cold winters and short, mild summers.
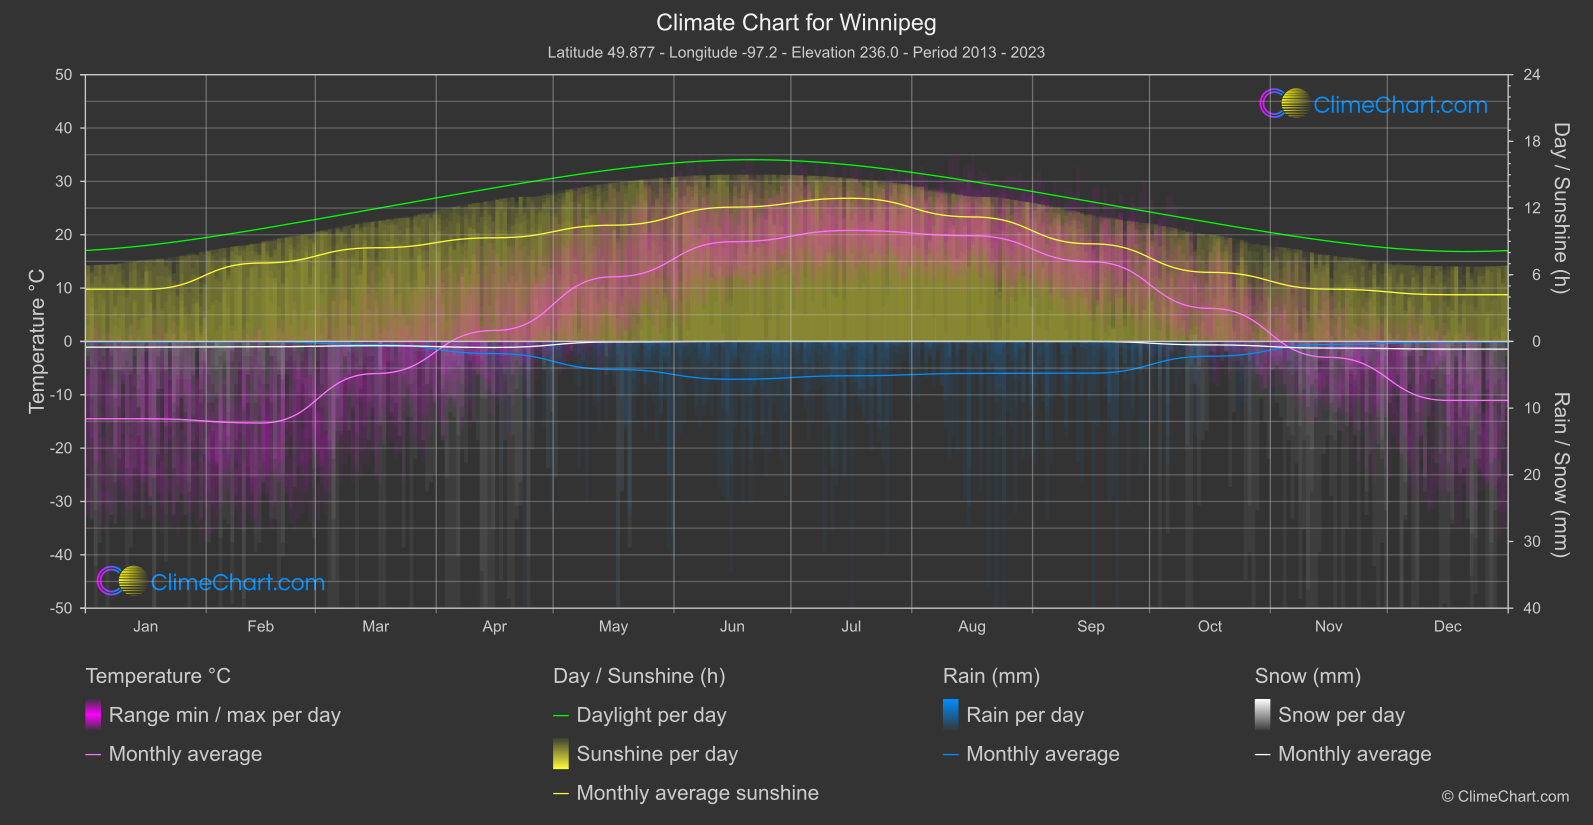
Winnipeg
Winnipeg, located in central Canada, experiences a humid continental climate with distinct seasonal variations.
Yellowknife
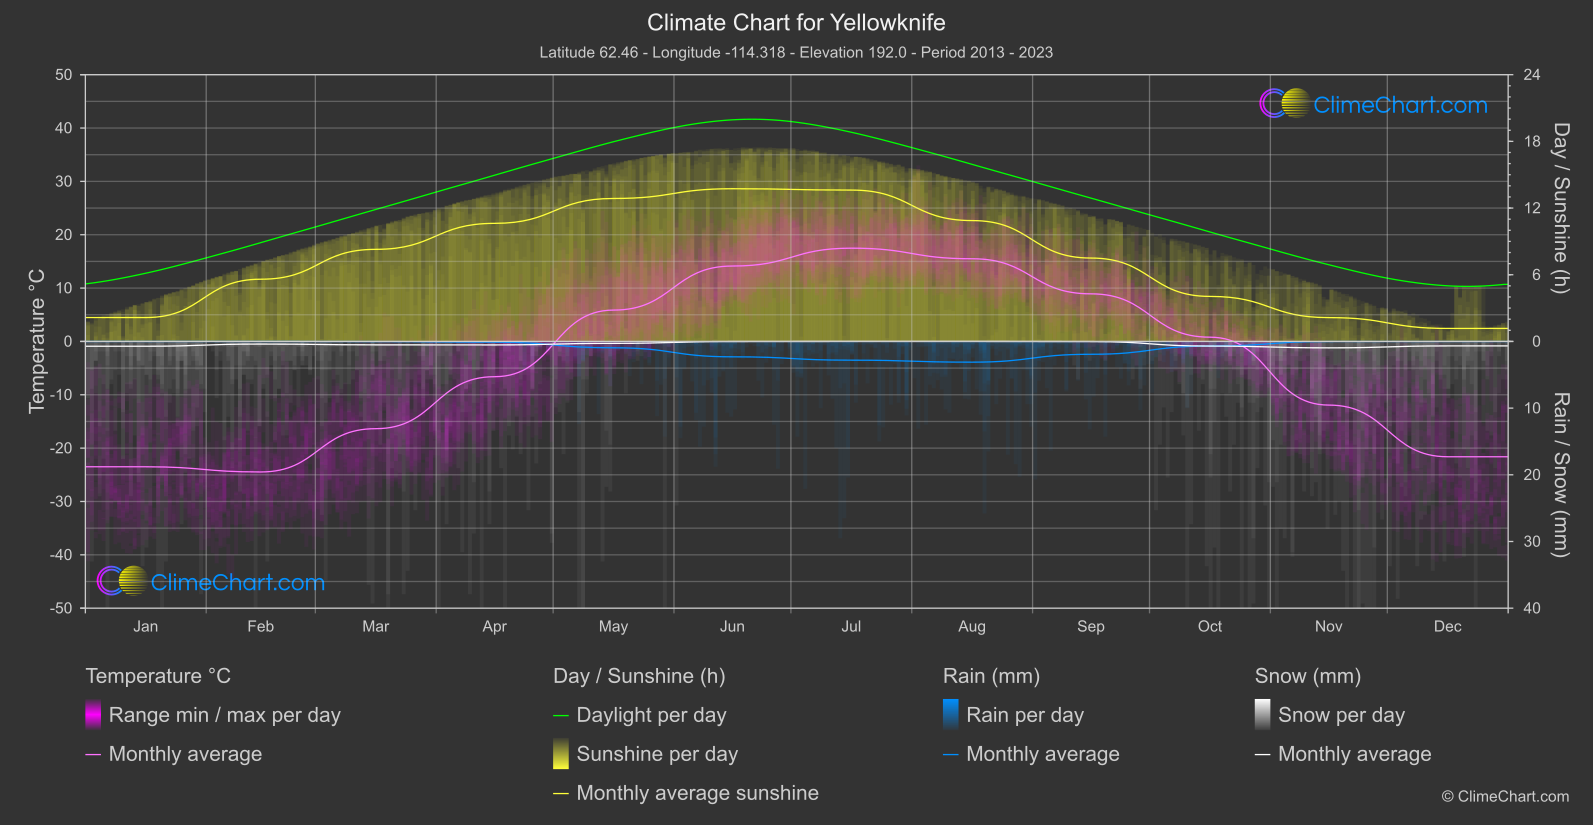
Yellowknife, the capital of Canada's Northwest Territories, experiences a subarctic climate with long, cold winters and short, warm summers.
Newfoundland
Region South-East
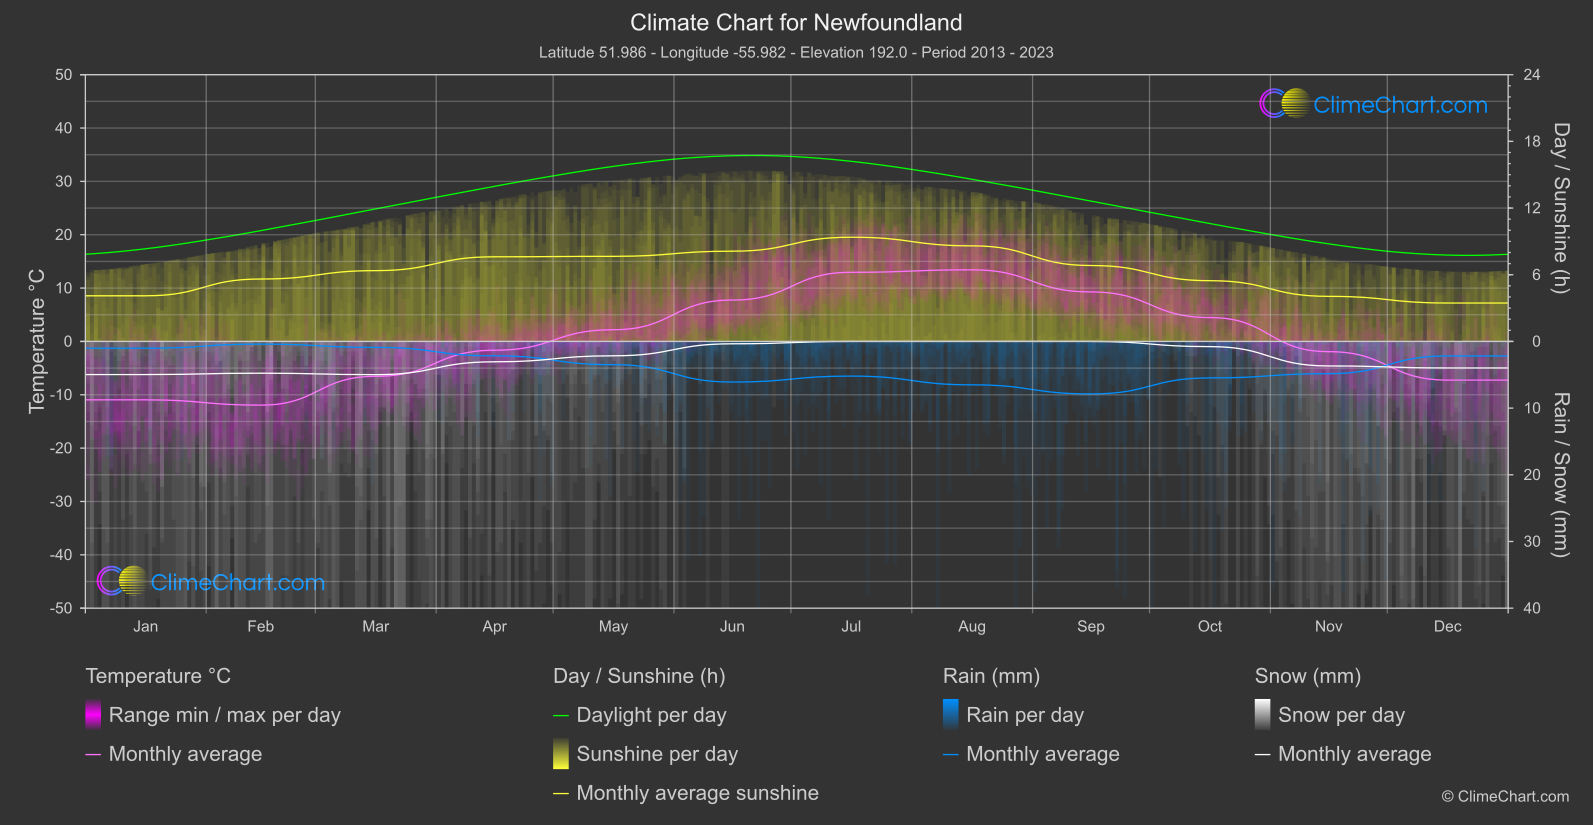
The coldest monthly mean is in February, at -11.
Niagara Falls
Region South-East
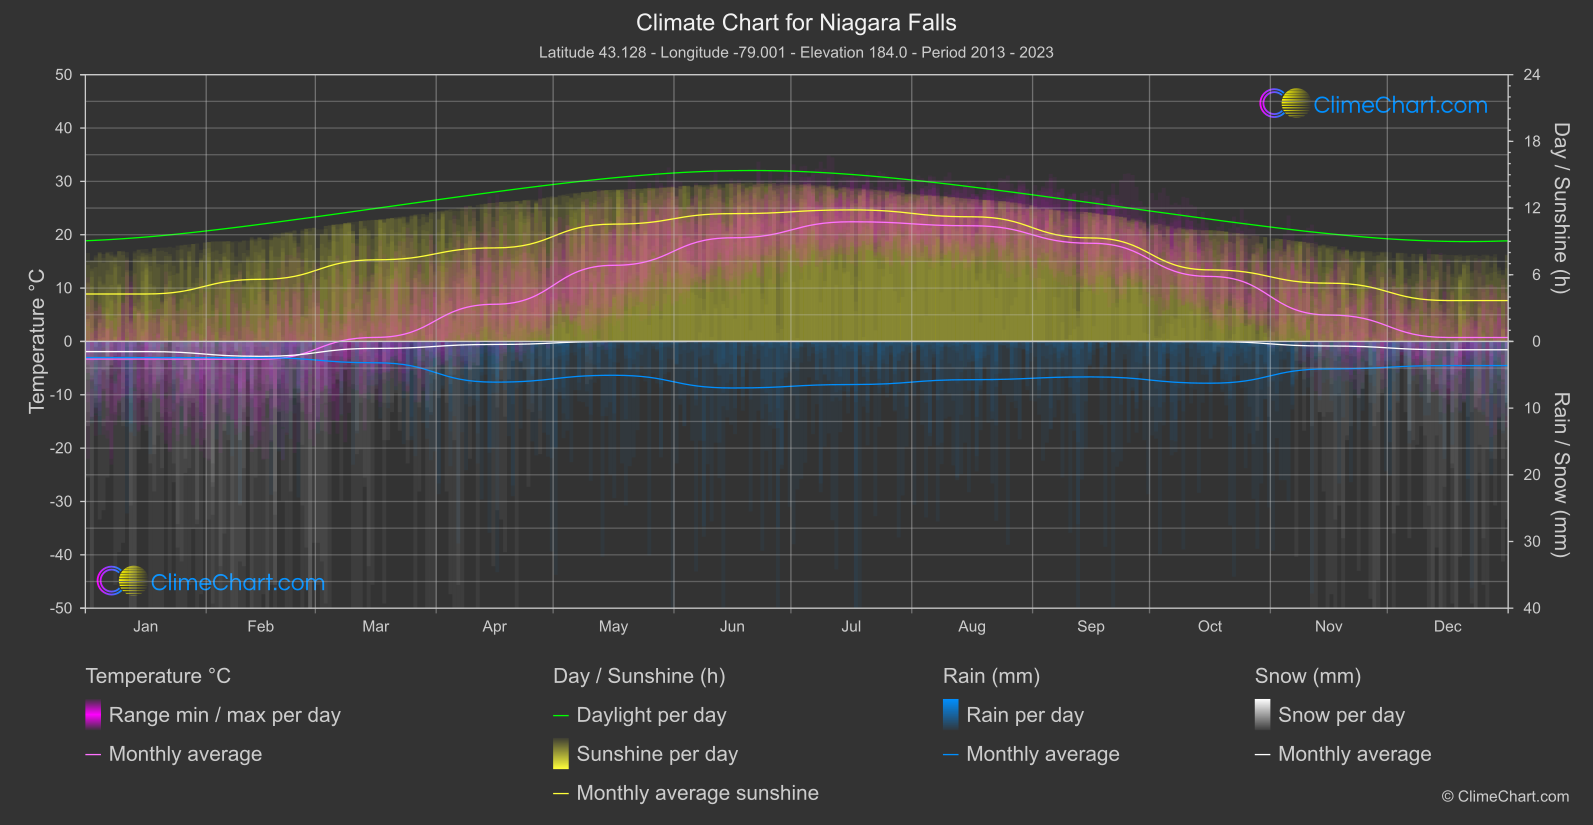
The coolest monthly mean temperatures are shared by January / February, at -3.
Prince Edward Island
Region South-East
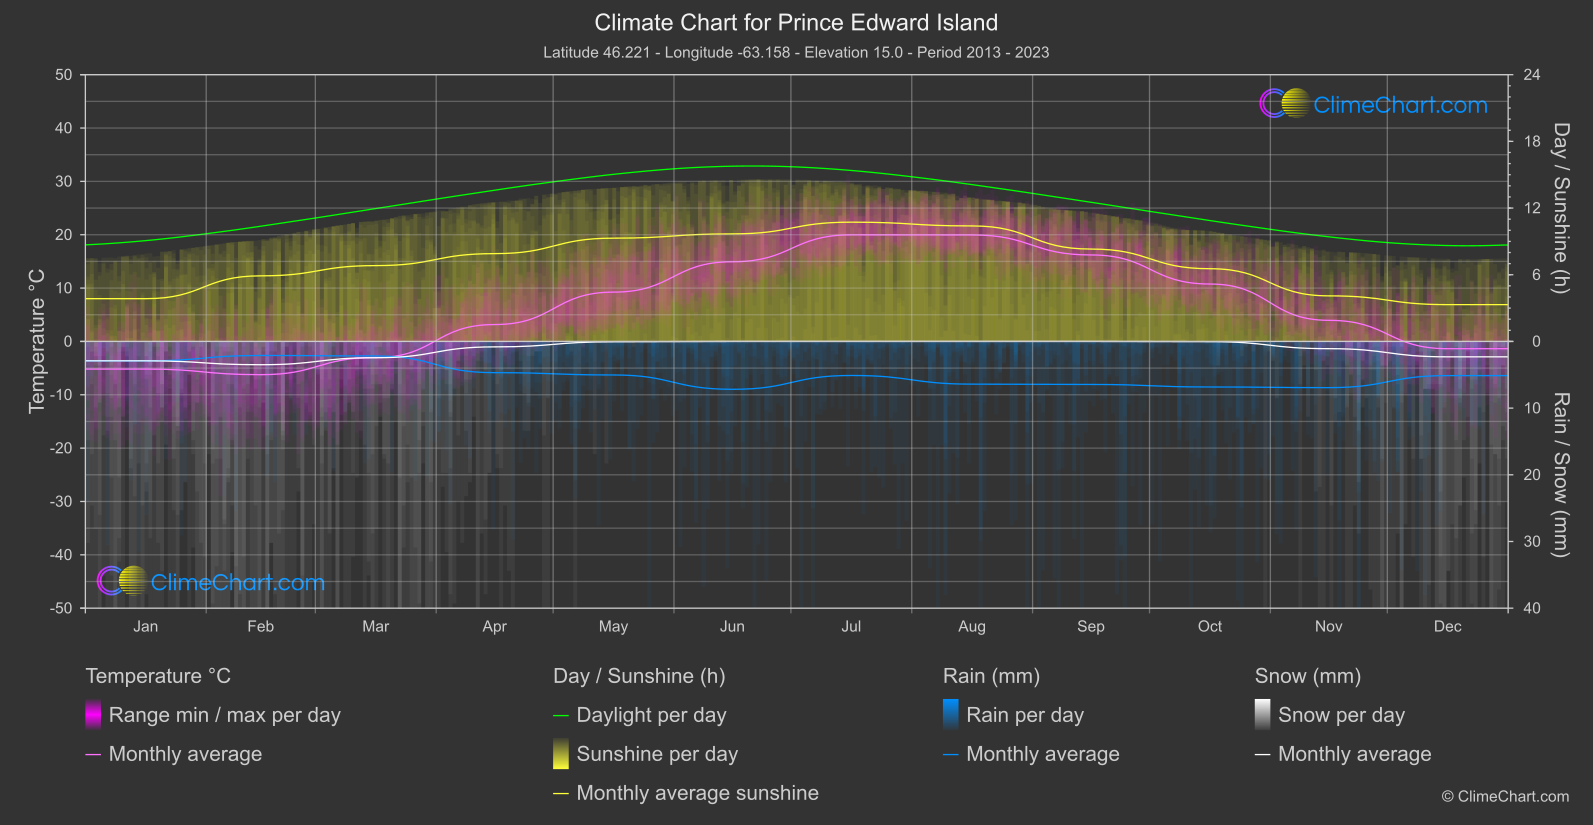
The coolest monthly mean temperature is in February, at -6.
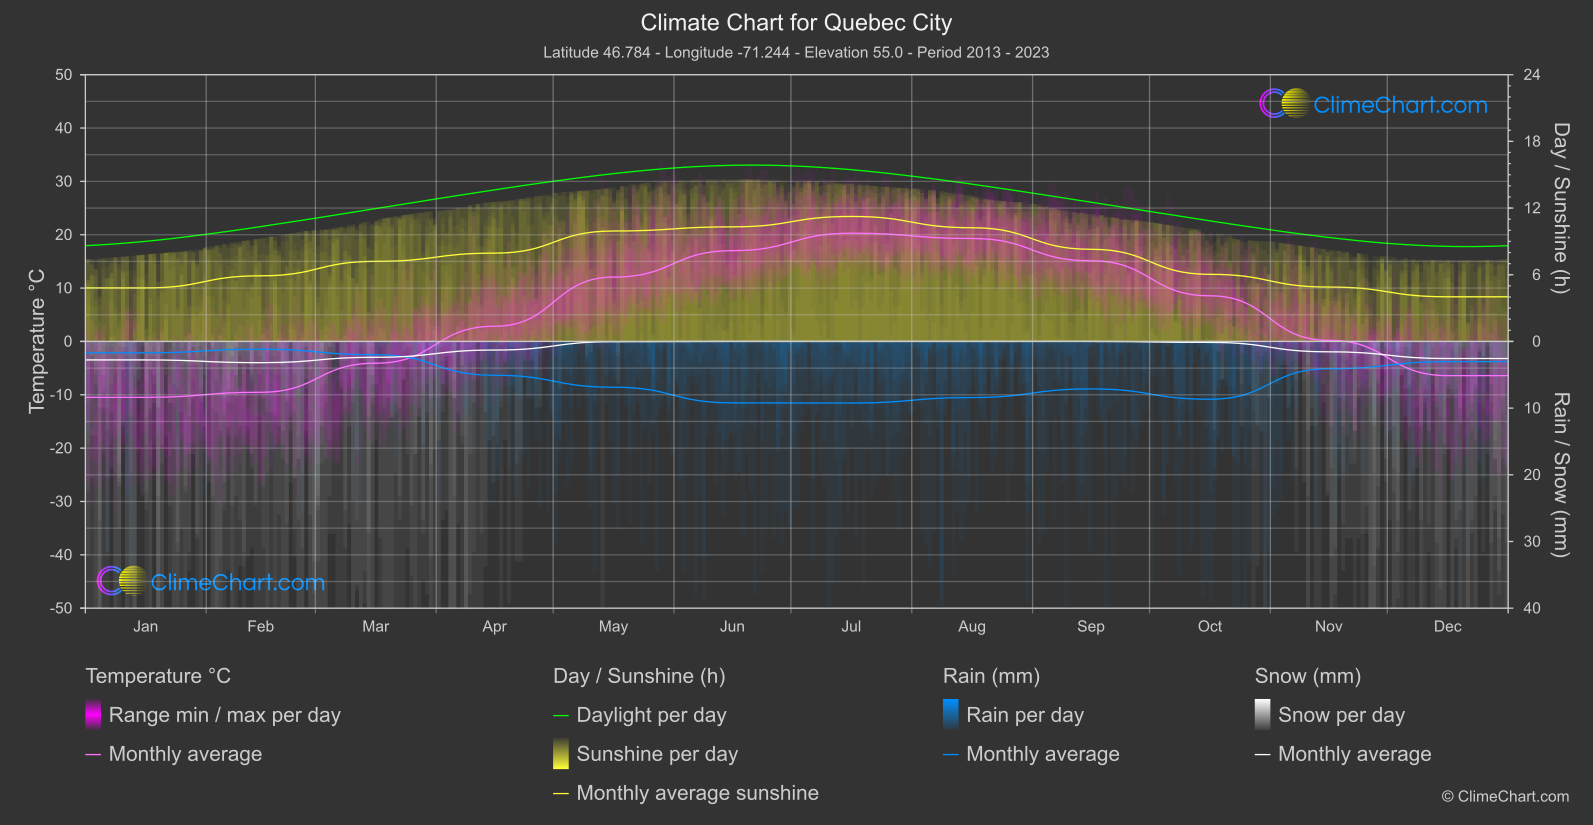
Quebec City
Region South-East
The monthly mean temperature is lowest in January, at -10.
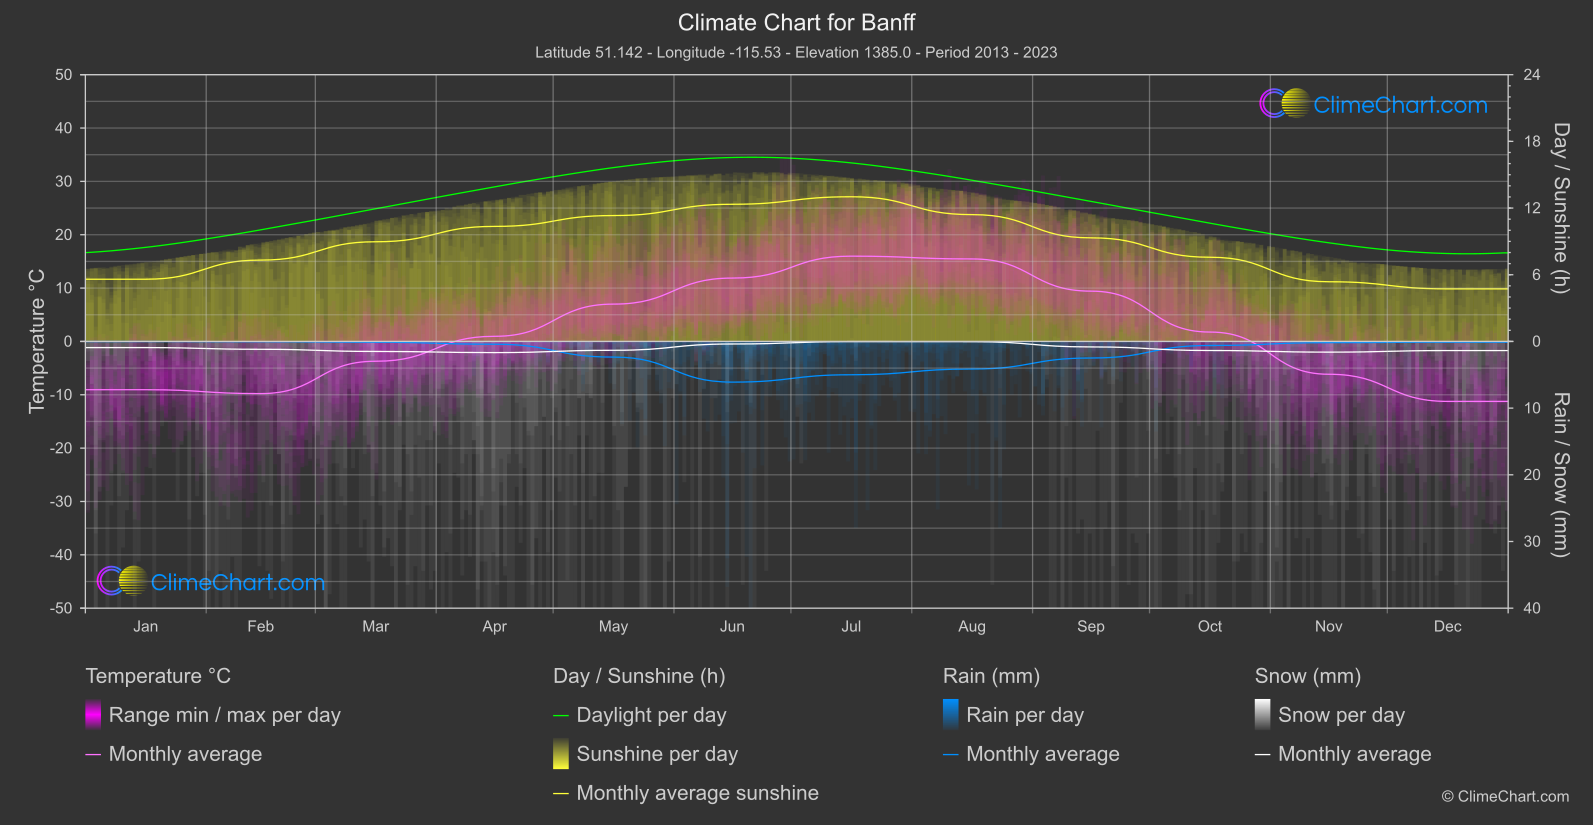
Banff
Region South-West
The warmest monthly mean is 16.
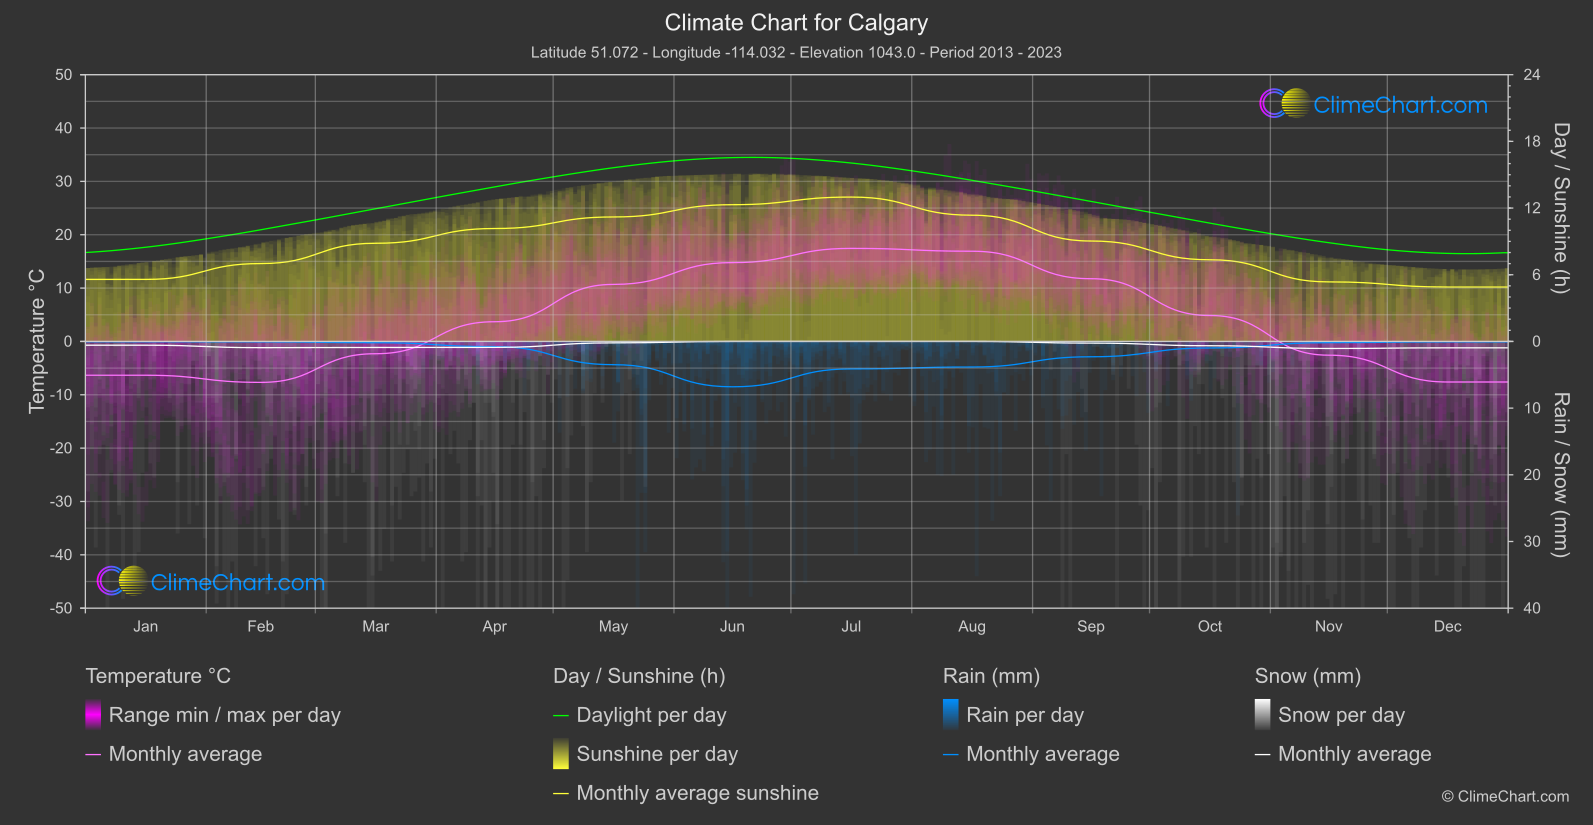
Calgary
Region South-West
The temperature figures are monthly means, not daytime highs: the coolest monthly mean is -7.
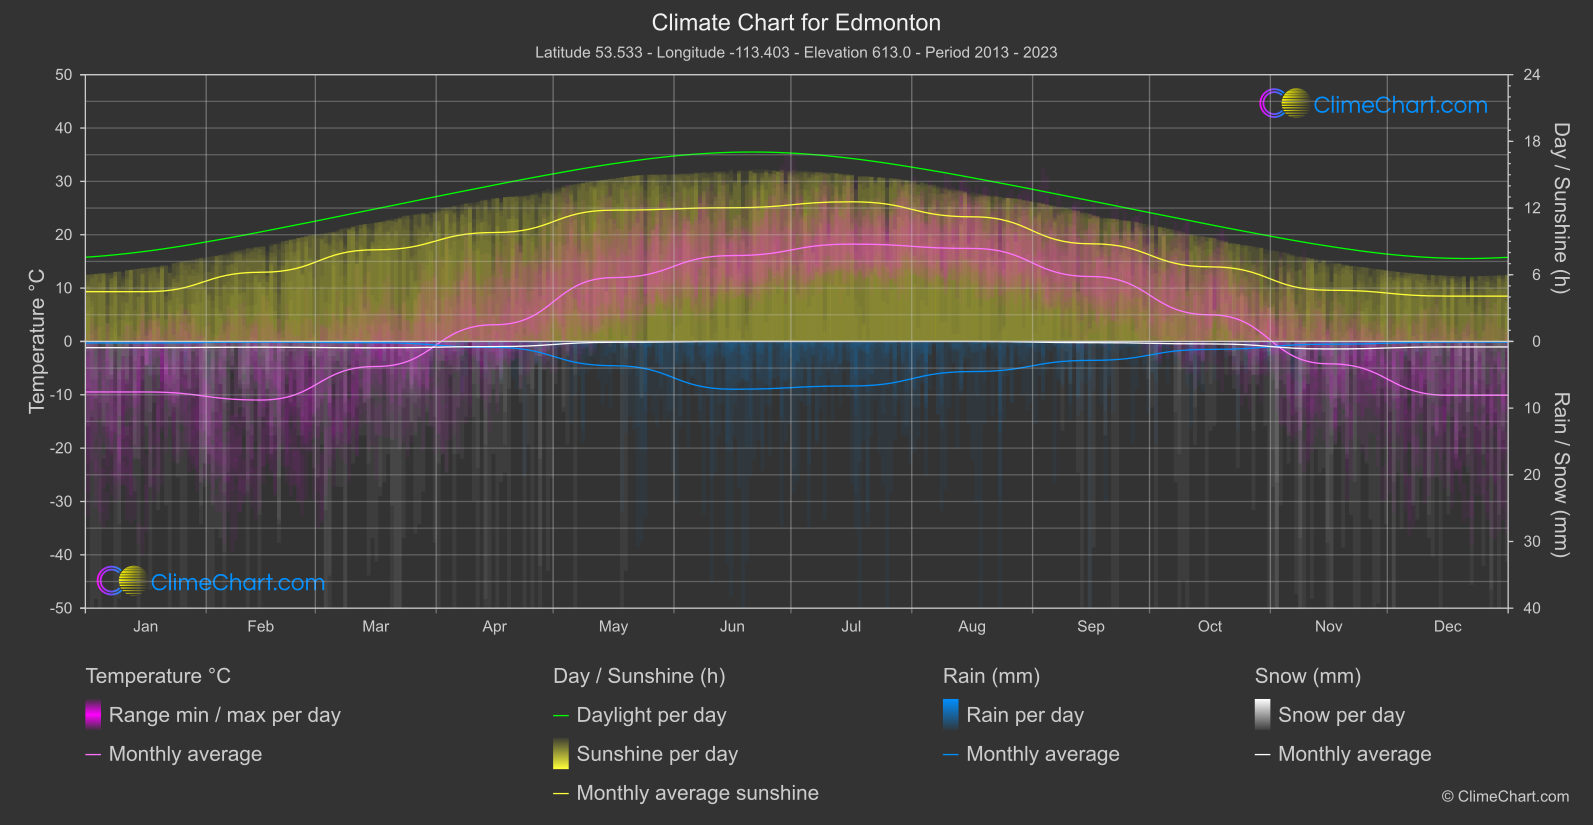
Edmonton
Region South-West
Monthly mean temperatures are lowest at -11.
Haida Gwaii
Region South-West
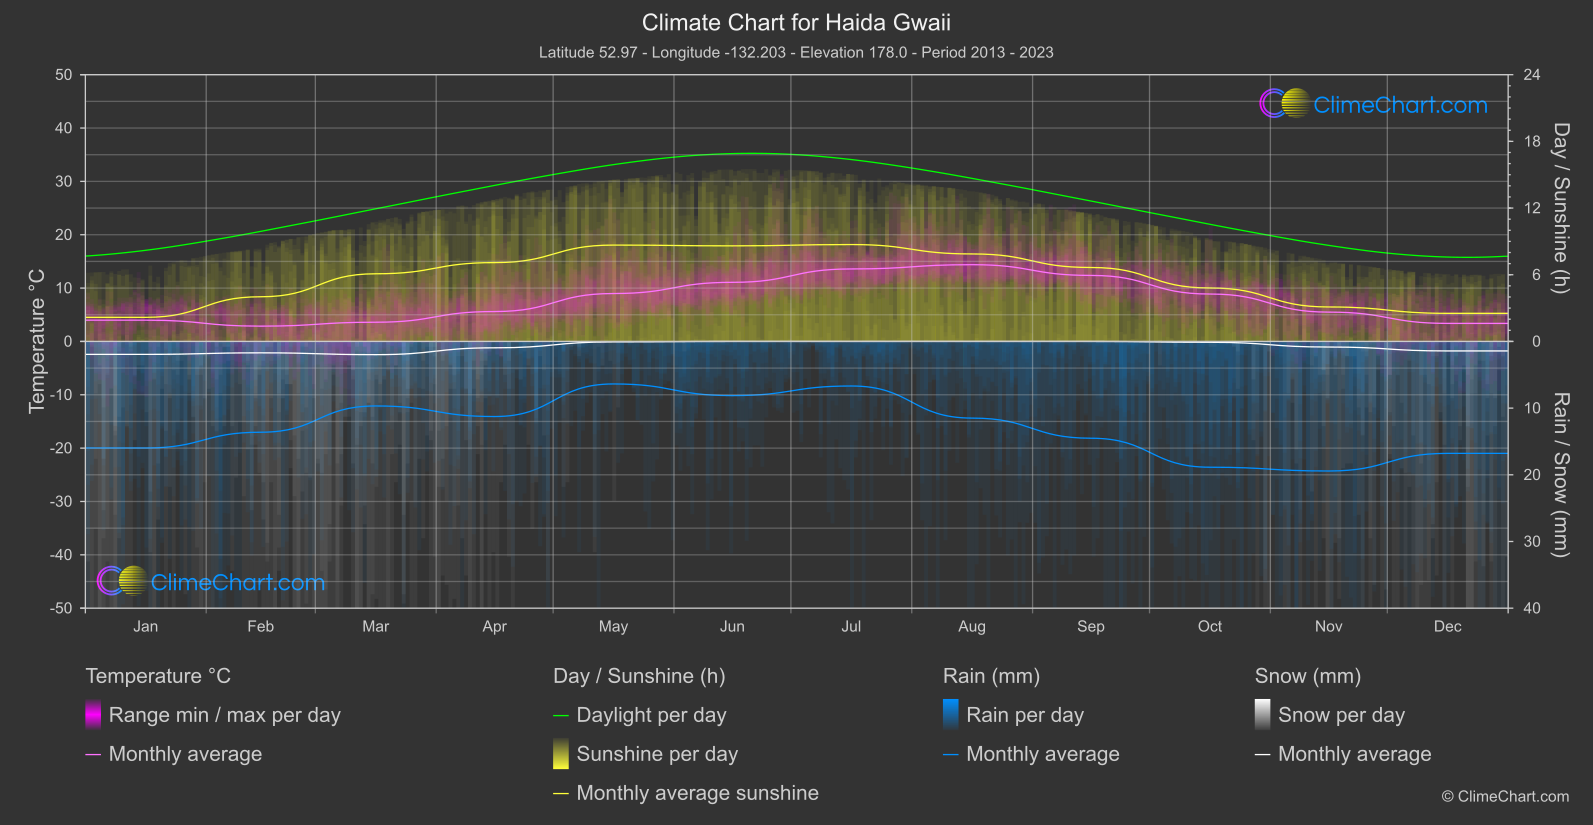
Monthly mean temperatures are lowest in February, at 2.
Toronto
Region South-East
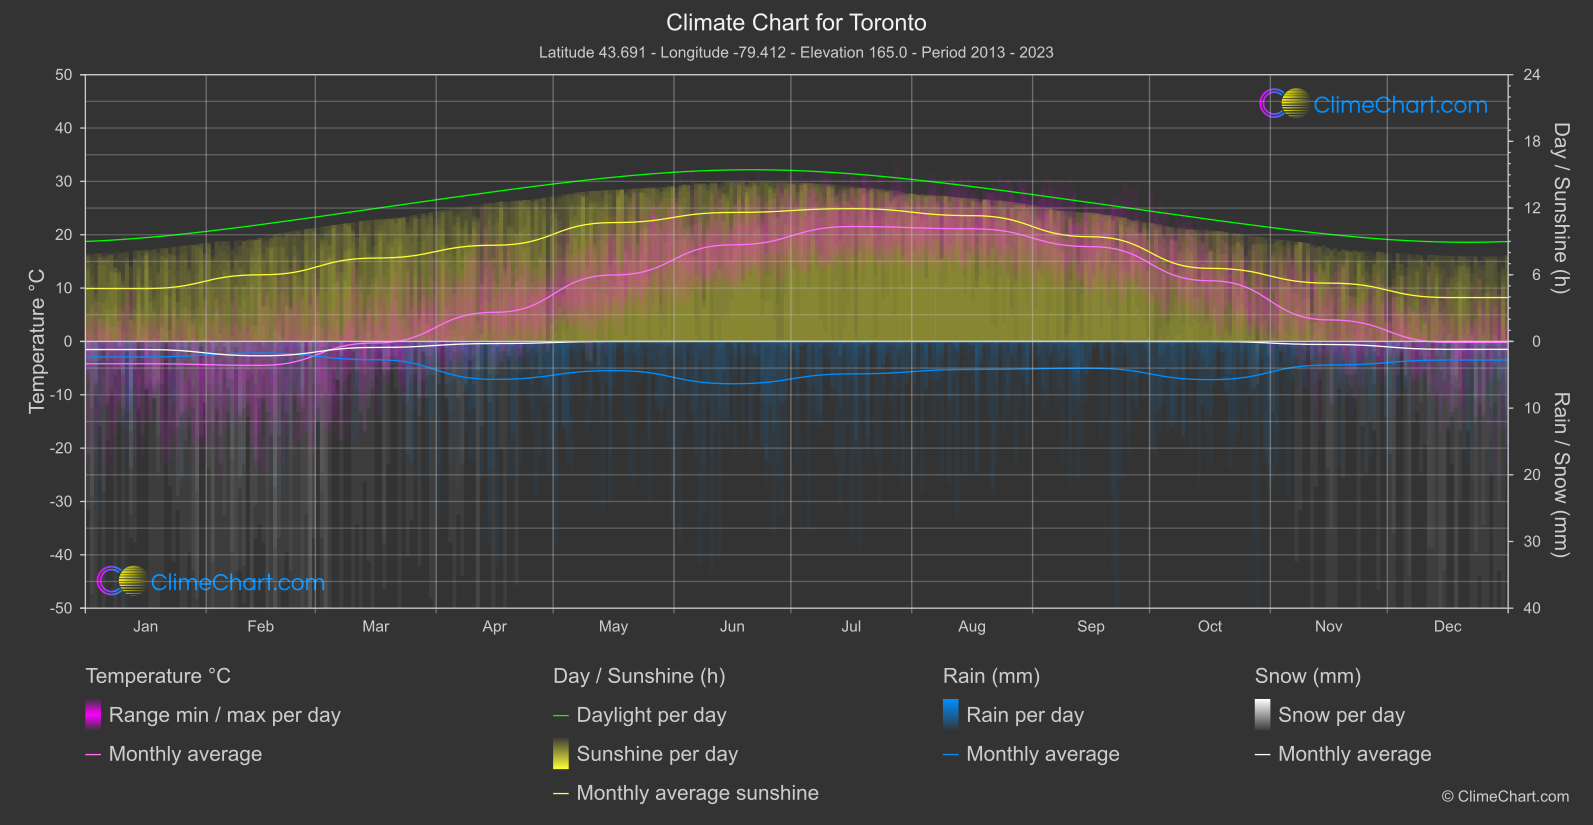
The monthly mean temperature is lowest at -4.
Montreal
Region South-East
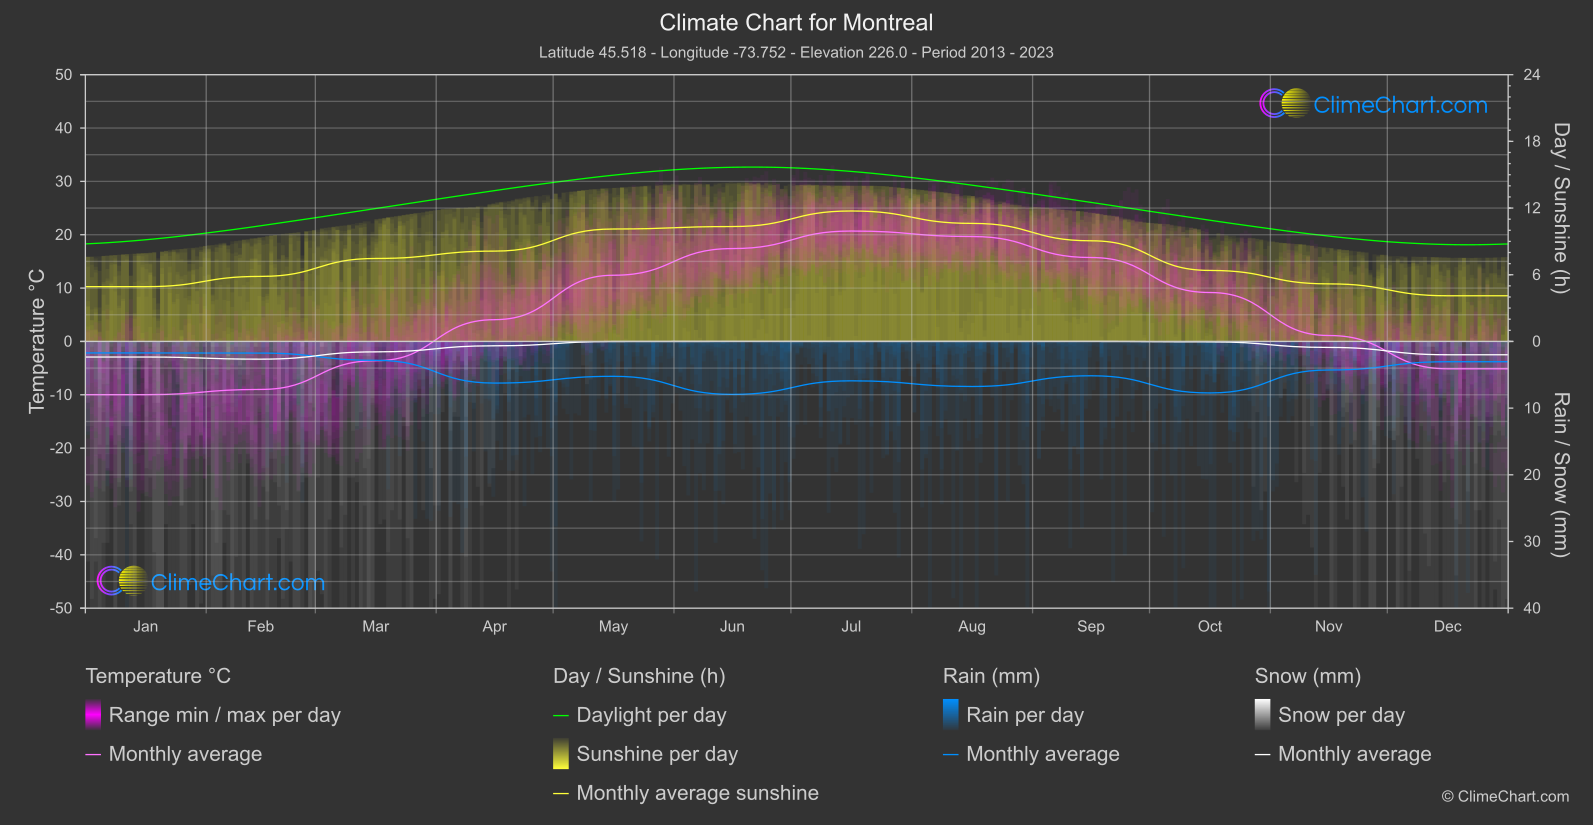
Monthly mean temperatures reach their highest point in July, at 20.
Vancouver
Region South-West
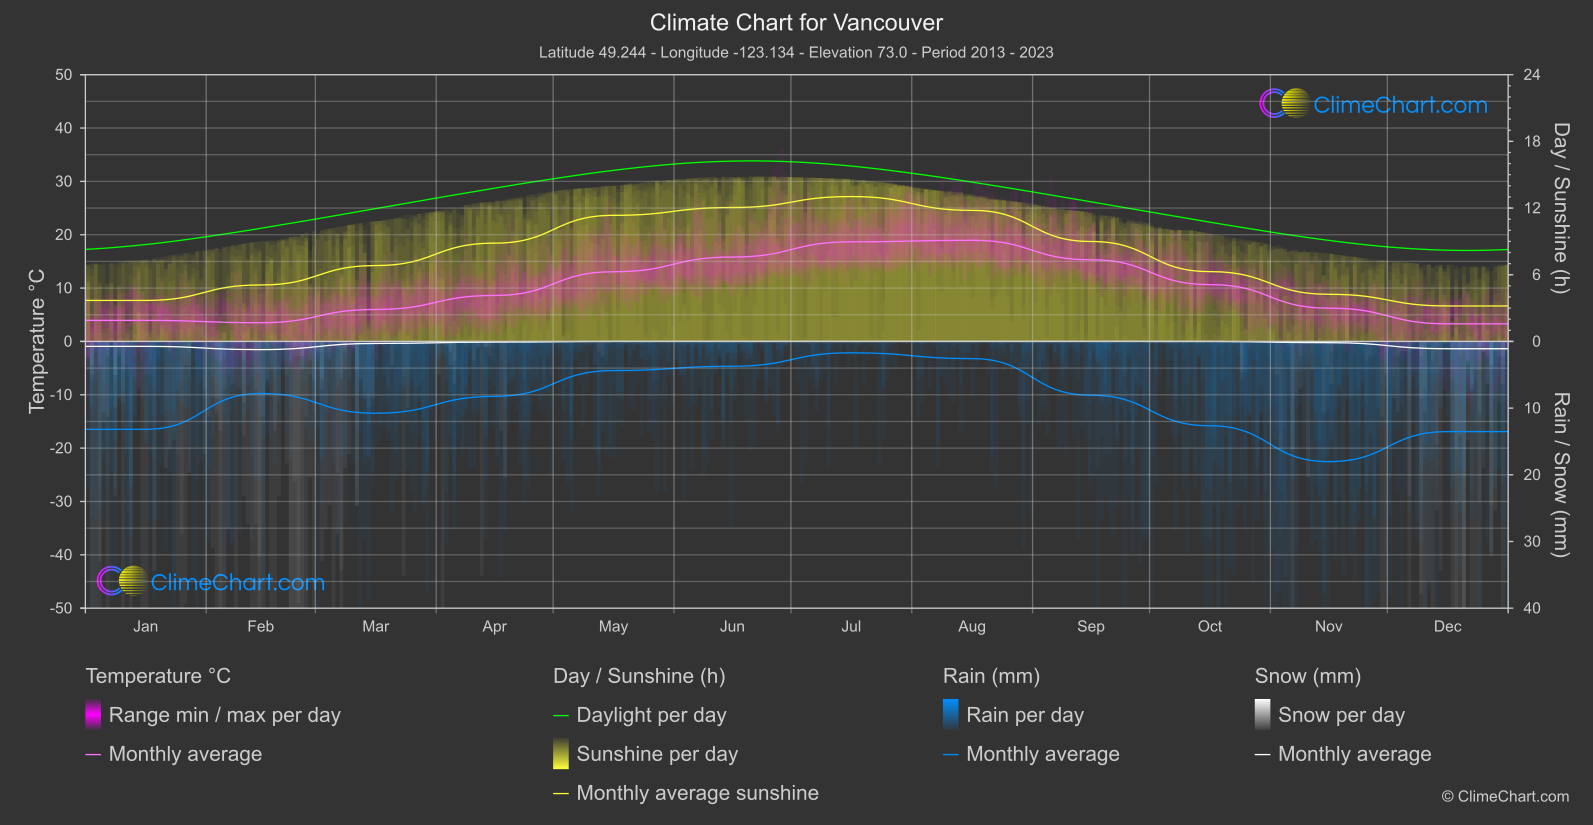
Vancouver, located in British Columbia, Canada, experiences a temperate oceanic climate with mild, wet winters and warm, dry summers.
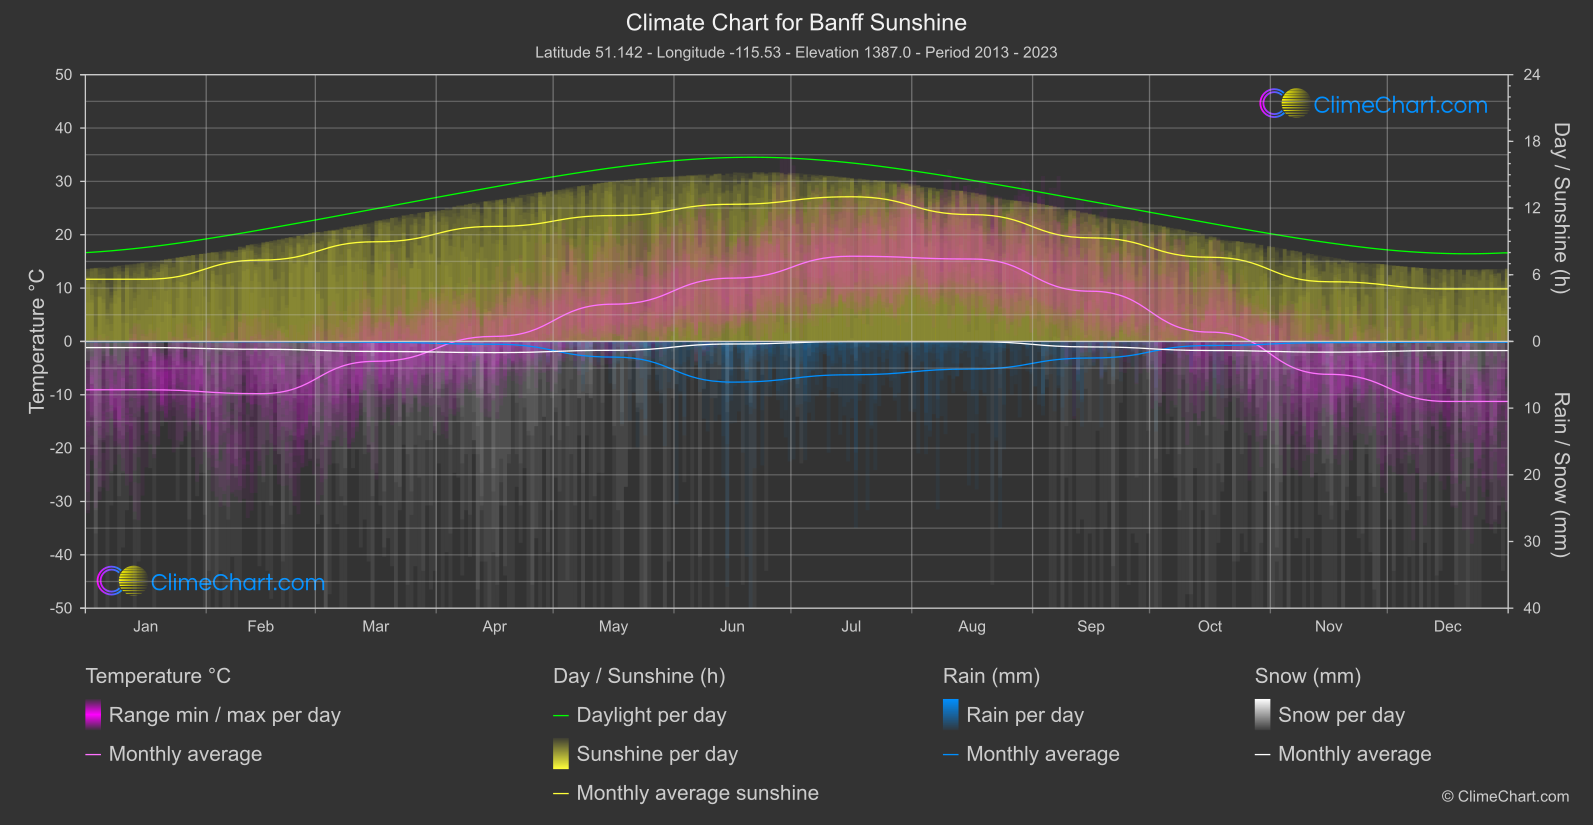
Banff Sunshine
Region South-West
Monthly mean temperatures range from a low of -11.
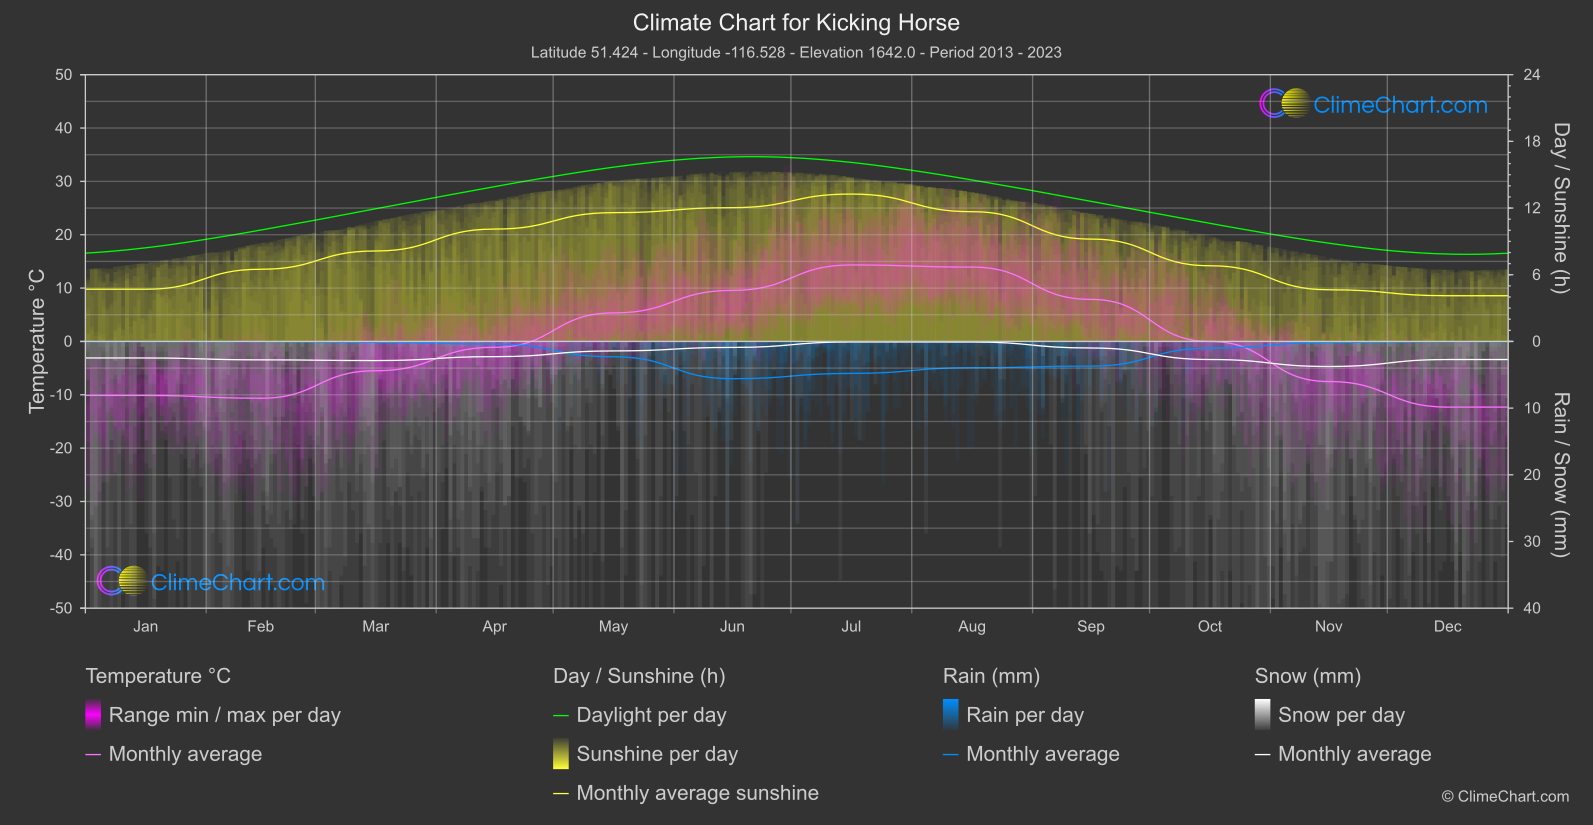
Kicking Horse
Region South-West
Monthly mean temperatures reach their highest point in July, at 14.
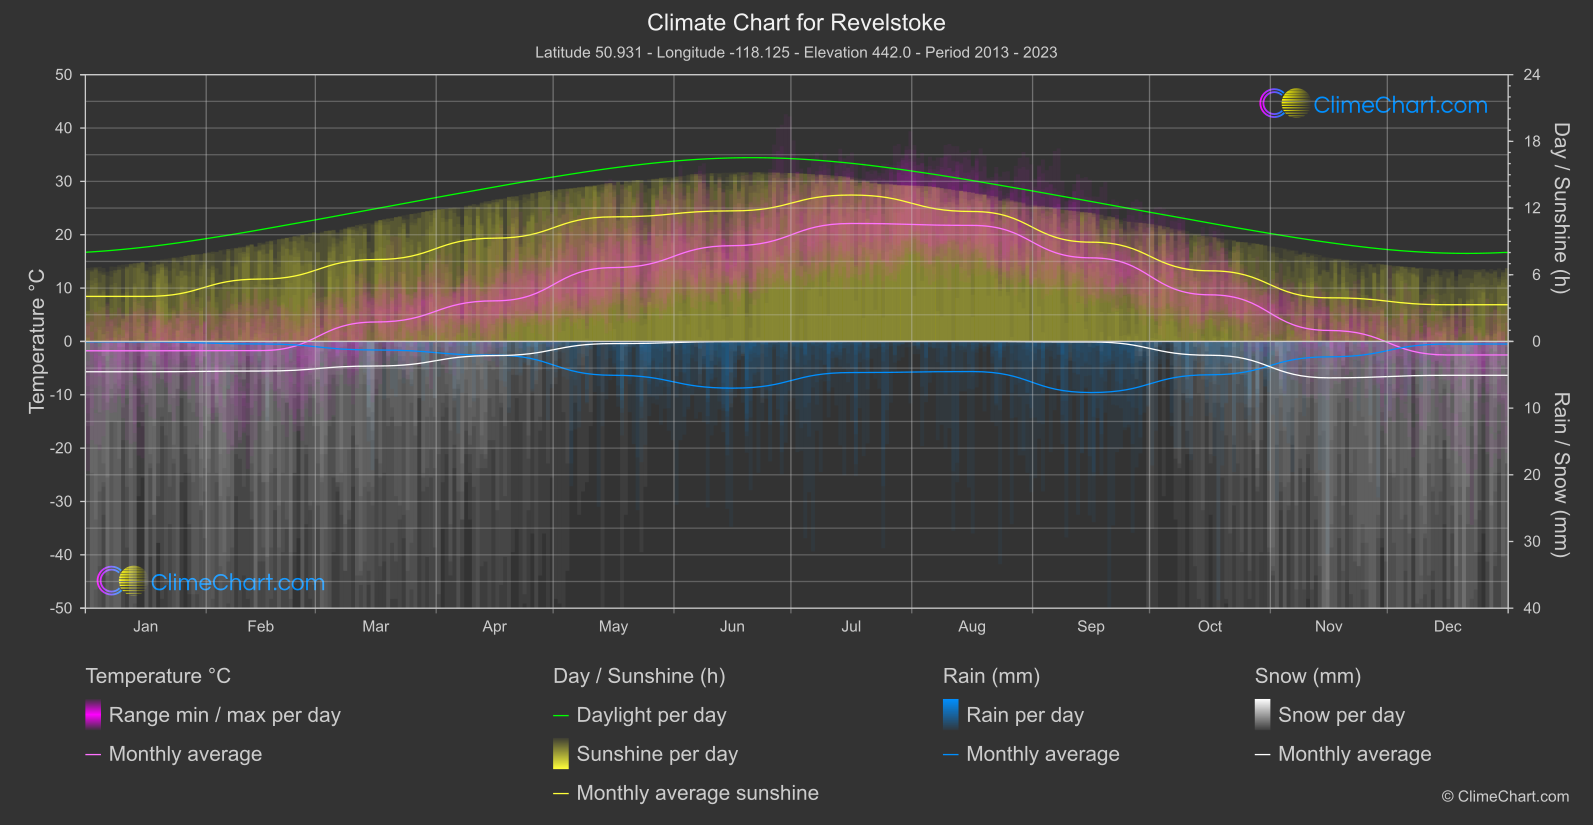
Revelstoke
Region South-West
December has the lowest monthly mean temperature, -2.
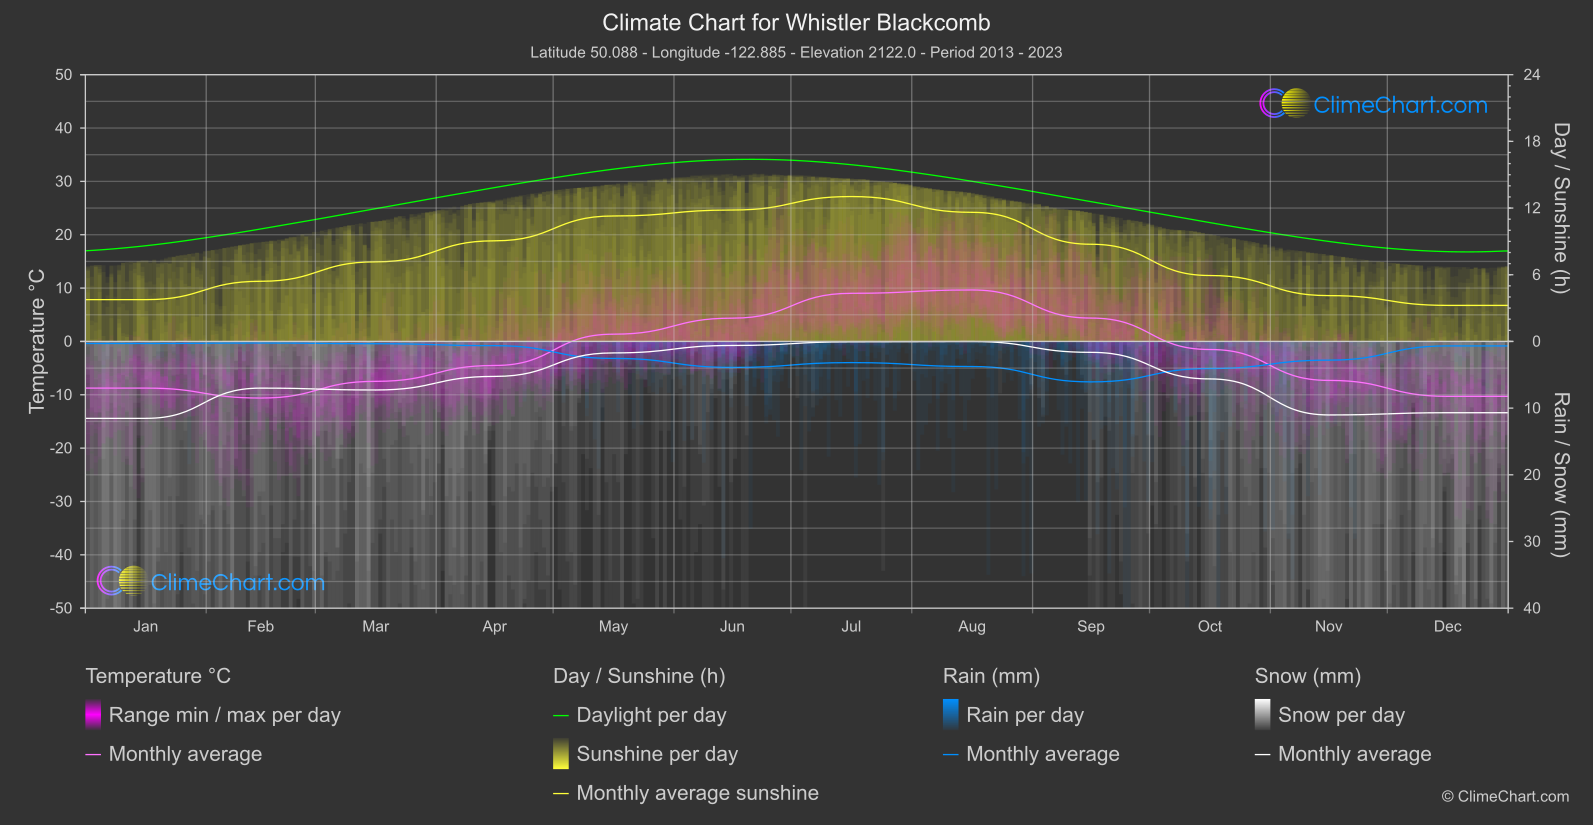
Whistler Blackcomb
Region South-West
Whistler Blackcomb experiences a maritime climate with cool, wet winters and mild summers.