Climate Change Chart of Newfoundland, Canada
Comprehensive Climate Change Chart of Newfoundland, Canada: Monthly Averages and Impact Trends
Exploring the Climate Change in Newfoundland, Canada
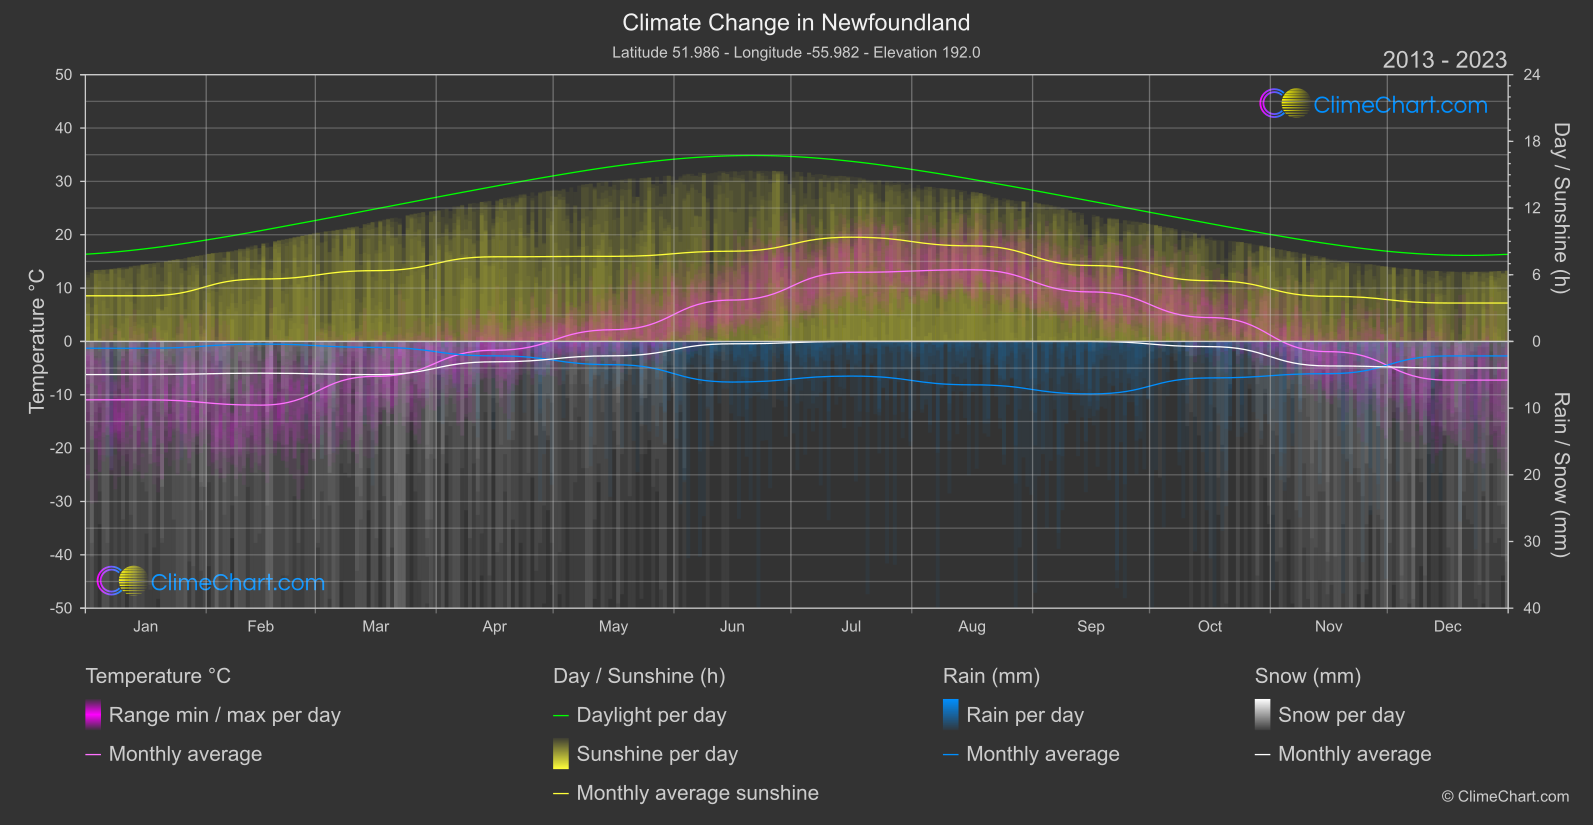
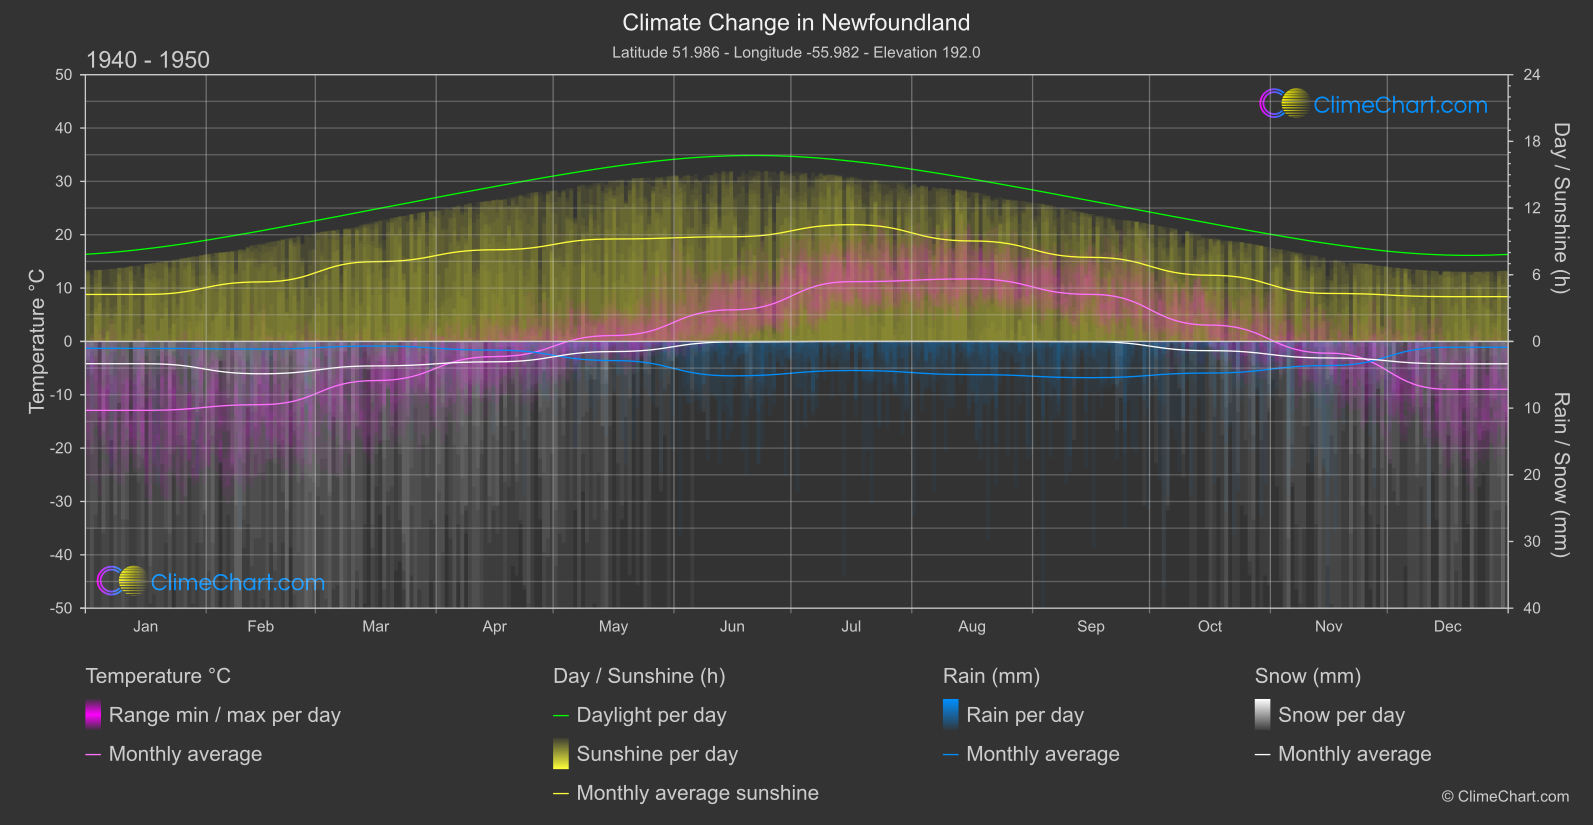
Newfoundland, Canada, has been experiencing notable climate changes. From temperature fluctuations to shifts in rainfall and snowfall patterns, the data from the 1940s to 1950s compared to recent years paint a clear picture. The month of May stands out with a significant increase in temperature, while September sees a rise in rainfall. The insights from this data offer valuable information for understanding the evolving climate in Newfoundland.
Climate Change Data Overview for Newfoundland, Canada
Explore the comprehensive climate change data for Newfoundland, Canada. This detailed table provides valuable insights into temperature variations, precipitation levels, and seasonal changes influenced by climate change, helping you understand the unique weather patterns of this region.
Temperature °C
| Month | ⌀ 1940 - 1950 | ⌀ 2013 - 2023 | +/- |
|---|---|---|---|
| Jan | -12.92 | -10.95 | 1.97 |
| Feb | -11.85 | -11.94 | -0.09 |
| Mar | -7.33 | -6.54 | 0.79 |
| Apr | -2.84 | -1.65 | 1.19 |
| May | 1.11 | 2.20 | 1.08 |
| Jun | 5.92 | 7.76 | 1.84 |
| Jul | 11.20 | 12.96 | 1.75 |
| Aug | 11.72 | 13.42 | 1.71 |
| Sep | 8.82 | 9.28 | 0.46 |
| Oct | 3.06 | 4.48 | 1.41 |
| Nov | -2.20 | -1.92 | 0.28 |
| Dec | -8.97 | -7.25 | 1.72 |
| ⌀ Month | -0.36 | 0.82 | 1.18 |
Sunshine (h)
| Month | ⌀ 1940 - 1950 | ⌀ 2013 - 2023 | +/- |
|---|---|---|---|
| Jan | 4.23 | 4.11 | -0.12 |
| Feb | 5.36 | 5.62 | 0.26 |
| Mar | 7.18 | 6.37 | -0.81 |
| Apr | 8.25 | 7.62 | -0.63 |
| May | 9.22 | 7.66 | -1.56 |
| Jun | 9.42 | 8.12 | -1.30 |
| Jul | 10.50 | 9.38 | -1.13 |
| Aug | 9.04 | 8.60 | -0.44 |
| Sep | 7.57 | 6.83 | -0.74 |
| Oct | 5.95 | 5.46 | -0.49 |
| Nov | 4.32 | 4.06 | -0.26 |
| Dec | 4.03 | 3.46 | -0.58 |
| ⌀ Month | 7.09 | 6.44 | -0.65 |
Rain (mm)
| Month | ⌀ 1940 - 1950 | ⌀ 2013 - 2023 | +/- |
|---|---|---|---|
| Jan | 0.52 | 0.51 | -0.01 |
| Feb | 0.57 | 0.20 | -0.37 |
| Mar | 0.35 | 0.45 | 0.10 |
| Apr | 0.65 | 1.08 | 0.43 |
| May | 1.44 | 1.74 | 0.31 |
| Jun | 2.58 | 3.05 | 0.47 |
| Jul | 2.18 | 2.60 | 0.42 |
| Aug | 2.49 | 3.25 | 0.77 |
| Sep | 2.72 | 3.94 | 1.22 |
| Oct | 2.37 | 2.74 | 0.37 |
| Nov | 1.81 | 2.42 | 0.61 |
| Dec | 0.44 | 1.09 | 0.65 |
| ⌀ Month | 1.51 | 1.92 | 0.41 |
Snow (mm)
| Month | ⌀ 1940 - 1950 | ⌀ 2013 - 2023 | +/- |
|---|---|---|---|
| Jan | 1.67 | 2.48 | 0.81 |
| Feb | 2.42 | 2.38 | -0.04 |
| Mar | 1.83 | 2.49 | 0.66 |
| Apr | 1.53 | 1.53 | 0.00 |
| May | 0.76 | 1.08 | 0.32 |
| Jun | 0.04 | 0.18 | 0.14 |
| Jul | 0.00 | 0.00 | 0.00 |
| Aug | 0.00 | 0.00 | 0.00 |
| Sep | 0.02 | 0.00 | -0.02 |
| Oct | 0.69 | 0.39 | -0.31 |
| Nov | 1.24 | 1.84 | 0.60 |
| Dec | 1.68 | 1.99 | 0.31 |
| ⌀ Month | 0.99 | 1.20 | 0.21 |