Climate Change Chart of Prince Edward Island, Canada
Comprehensive Climate Change Chart of Prince Edward Island, Canada: Monthly Averages and Impact Trends
Explore the changing climate in Prince Edward Island, Canada, through insightful data analysis.
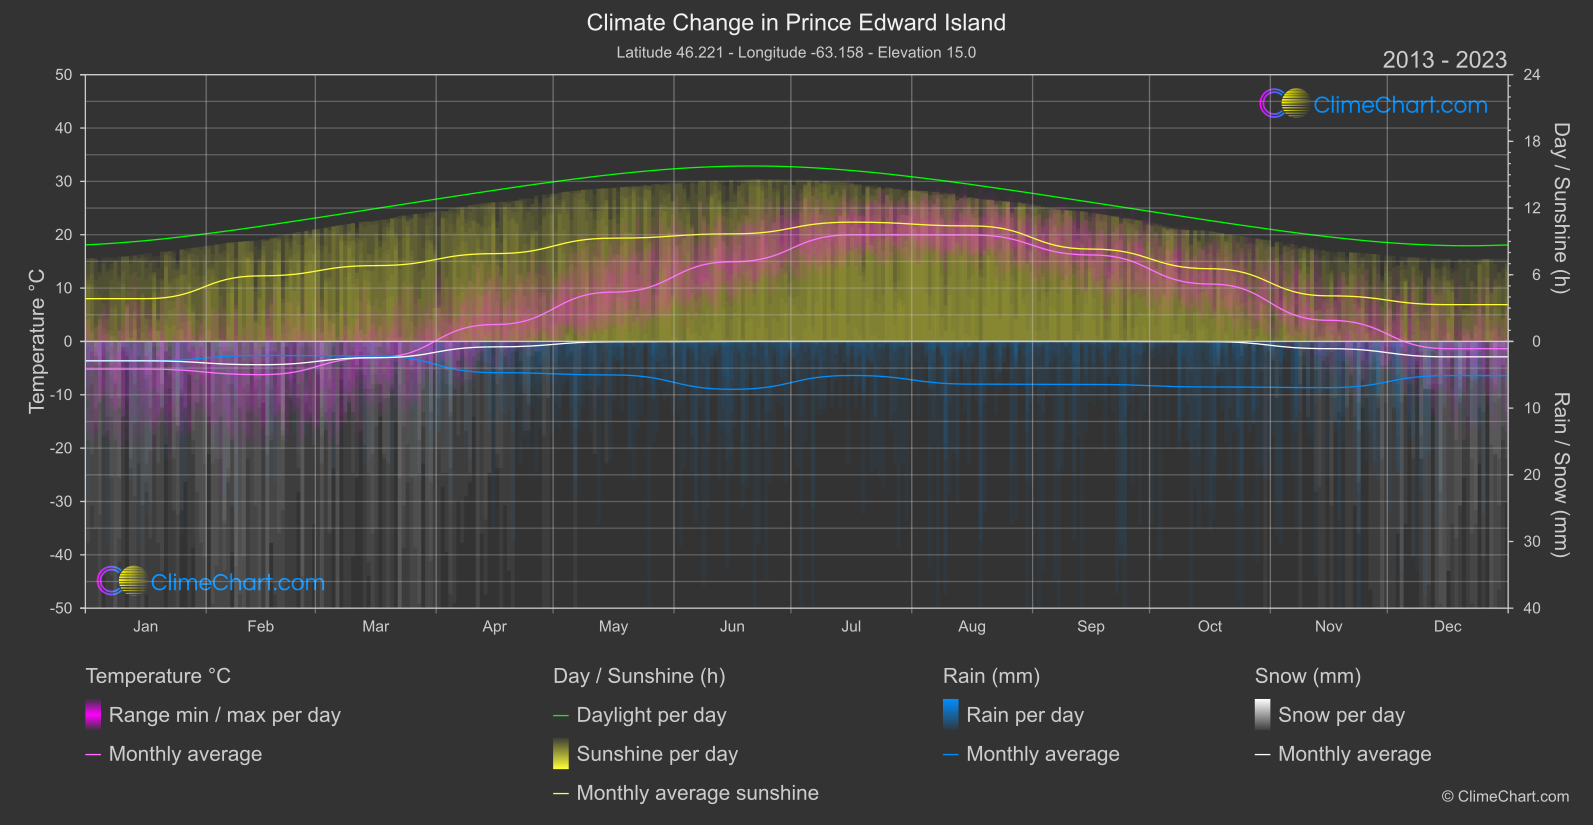
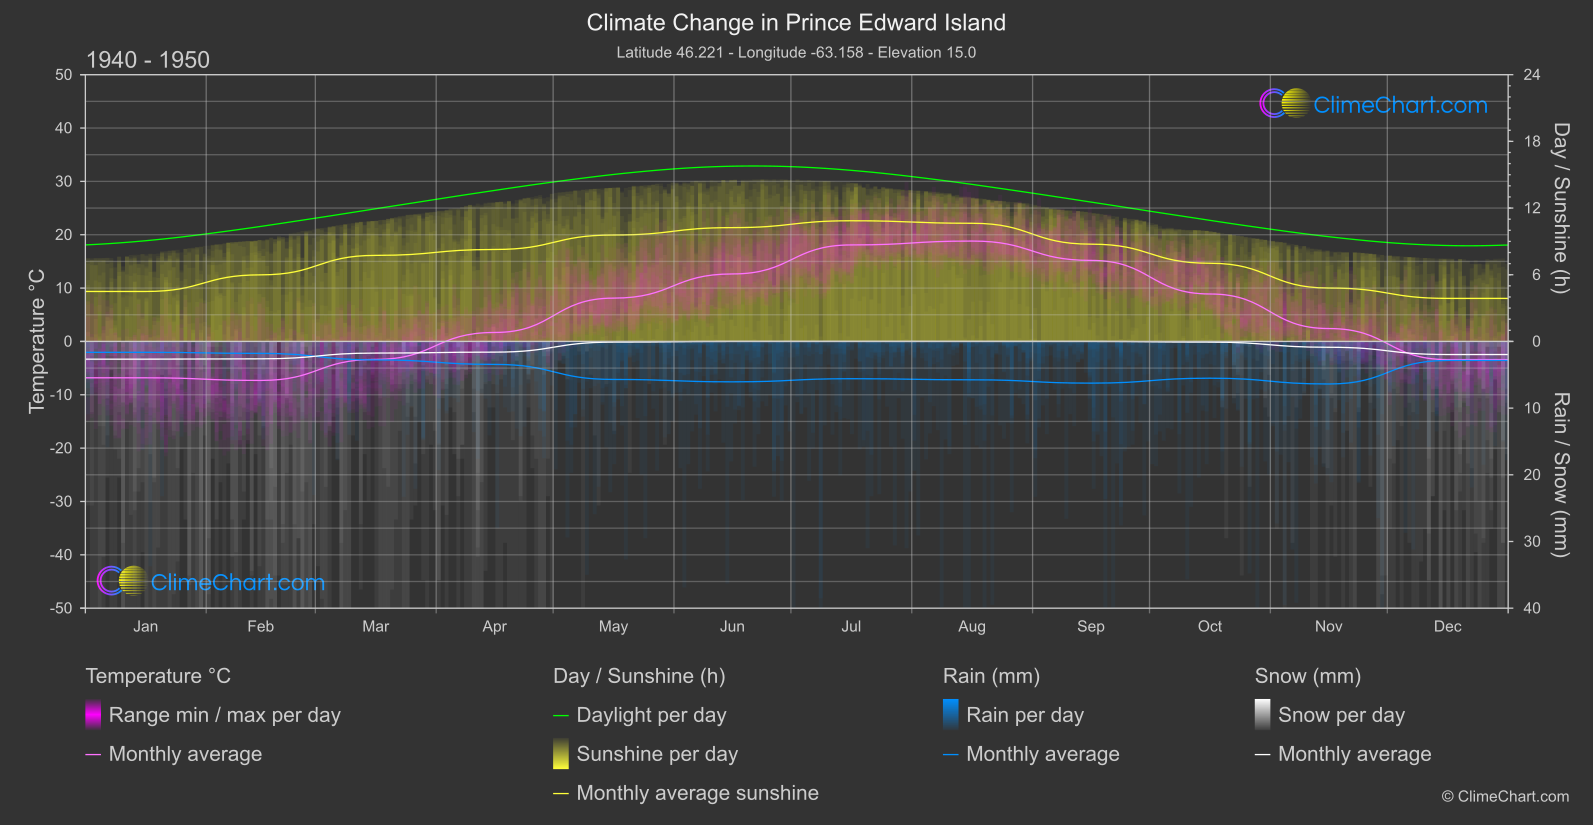
Prince Edward Island, Canada, has witnessed significant changes in temperature, rainfall, snowfall, and sunshine duration from the 1940s to the 2020s. Among the data, June stands out with the highest temperature increase of 2.28°C and December with the highest snowfall change of 0.17mm. Additionally, January experienced the biggest rainfall difference with a change of 0.64mm, while March had the most significant decrease in sunshine duration by 0.92 hours.
Climate Change Data Overview for Prince Edward Island, Canada
Explore the comprehensive climate change data for Prince Edward Island, Canada. This detailed table provides valuable insights into temperature variations, precipitation levels, and seasonal changes influenced by climate change, helping you understand the unique weather patterns of this region.
Temperature °C
| Month | ⌀ 1940 - 1950 | ⌀ 2013 - 2023 | +/- |
|---|---|---|---|
| Jan | -6.82 | -5.18 | 1.64 |
| Feb | -7.31 | -6.23 | 1.08 |
| Mar | -3.36 | -3.02 | 0.35 |
| Apr | 1.68 | 3.16 | 1.48 |
| May | 8.12 | 9.24 | 1.13 |
| Jun | 12.65 | 14.93 | 2.28 |
| Jul | 18.09 | 19.98 | 1.89 |
| Aug | 18.81 | 19.96 | 1.15 |
| Sep | 15.19 | 16.21 | 1.02 |
| Oct | 8.89 | 10.76 | 1.87 |
| Nov | 2.42 | 3.95 | 1.54 |
| Dec | -3.40 | -1.36 | 2.04 |
| ⌀ Month | 5.41 | 6.87 | 1.46 |
Sunshine (h)
| Month | ⌀ 1940 - 1950 | ⌀ 2013 - 2023 | +/- |
|---|---|---|---|
| Jan | 4.50 | 3.85 | -0.65 |
| Feb | 5.99 | 5.90 | -0.09 |
| Mar | 7.74 | 6.82 | -0.92 |
| Apr | 8.27 | 7.90 | -0.37 |
| May | 9.58 | 9.29 | -0.28 |
| Jun | 10.24 | 9.68 | -0.56 |
| Jul | 10.86 | 10.73 | -0.13 |
| Aug | 10.63 | 10.39 | -0.24 |
| Sep | 8.75 | 8.31 | -0.44 |
| Oct | 7.03 | 6.54 | -0.49 |
| Nov | 4.80 | 4.10 | -0.70 |
| Dec | 3.87 | 3.31 | -0.56 |
| ⌀ Month | 7.69 | 7.24 | -0.45 |
Rain (mm)
| Month | ⌀ 1940 - 1950 | ⌀ 2013 - 2023 | +/- |
|---|---|---|---|
| Jan | 0.82 | 1.46 | 0.64 |
| Feb | 0.90 | 1.05 | 0.15 |
| Mar | 1.38 | 1.09 | -0.30 |
| Apr | 1.72 | 2.34 | 0.62 |
| May | 2.85 | 2.52 | -0.33 |
| Jun | 3.03 | 3.59 | 0.56 |
| Jul | 2.80 | 2.55 | -0.24 |
| Aug | 2.88 | 3.20 | 0.33 |
| Sep | 3.13 | 3.23 | 0.10 |
| Oct | 2.76 | 3.41 | 0.66 |
| Nov | 3.19 | 3.46 | 0.27 |
| Dec | 1.43 | 2.56 | 1.14 |
| ⌀ Month | 2.24 | 2.54 | 0.30 |
Snow (mm)
| Month | ⌀ 1940 - 1950 | ⌀ 2013 - 2023 | +/- |
|---|---|---|---|
| Jan | 1.33 | 1.46 | 0.13 |
| Feb | 1.31 | 1.75 | 0.44 |
| Mar | 0.87 | 1.22 | 0.35 |
| Apr | 0.80 | 0.41 | -0.39 |
| May | 0.05 | 0.03 | -0.02 |
| Jun | 0.00 | 0.00 | 0.00 |
| Jul | 0.00 | 0.00 | 0.00 |
| Aug | 0.00 | 0.00 | 0.00 |
| Sep | 0.00 | 0.00 | 0.00 |
| Oct | 0.05 | 0.02 | -0.03 |
| Nov | 0.44 | 0.54 | 0.11 |
| Dec | 0.98 | 1.16 | 0.17 |
| ⌀ Month | 0.49 | 0.55 | 0.06 |