Climate Change Chart of Vancouver, Canada
Comprehensive Climate Change Chart of Vancouver, Canada: Monthly Averages and Impact Trends
Explore the climate changes in Vancouver, Canada over the years with insightful data analysis.
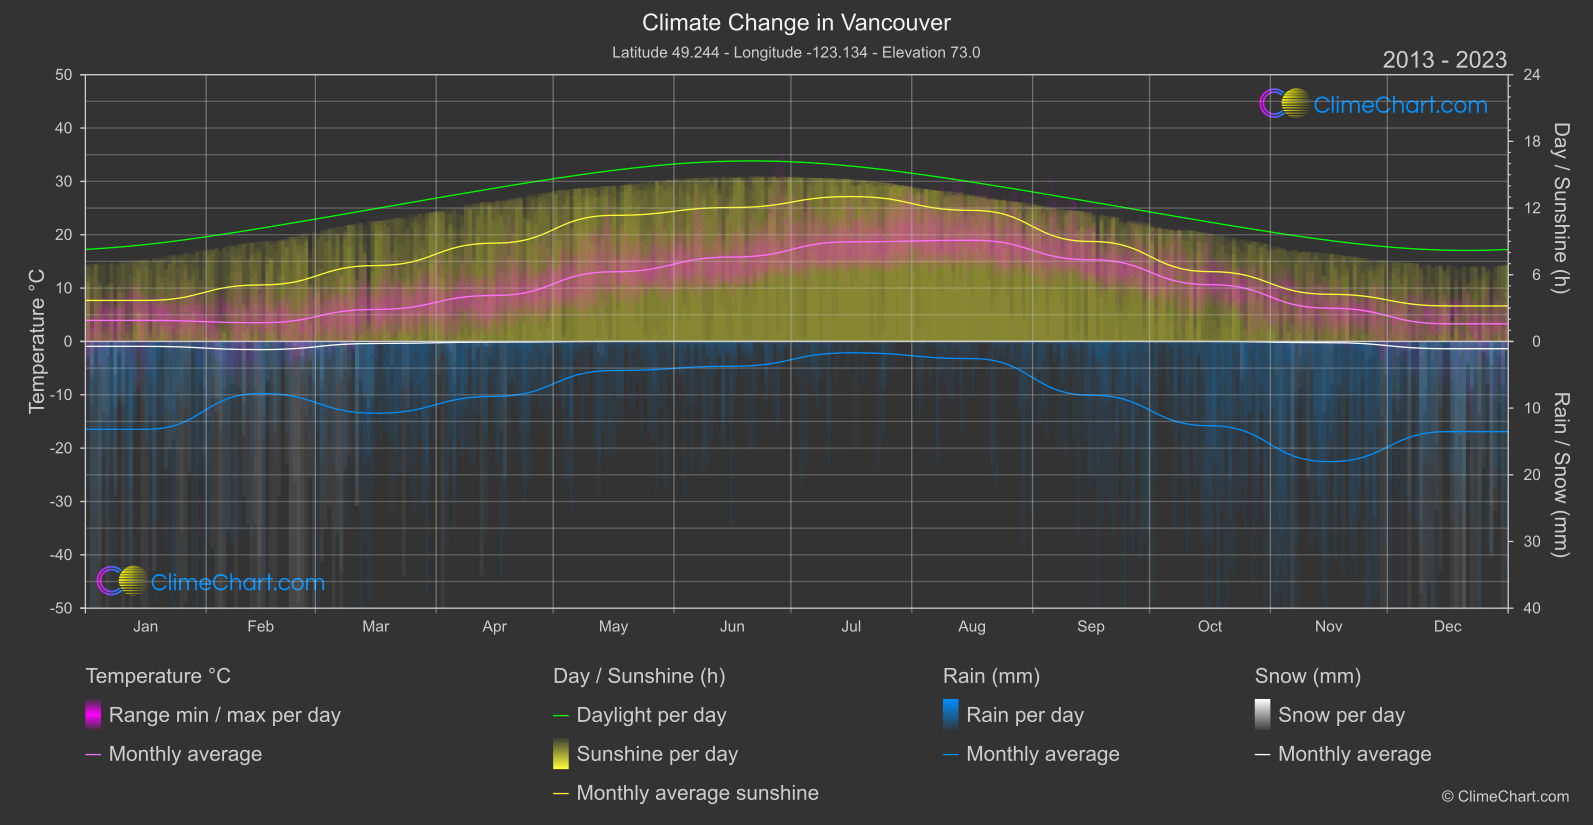
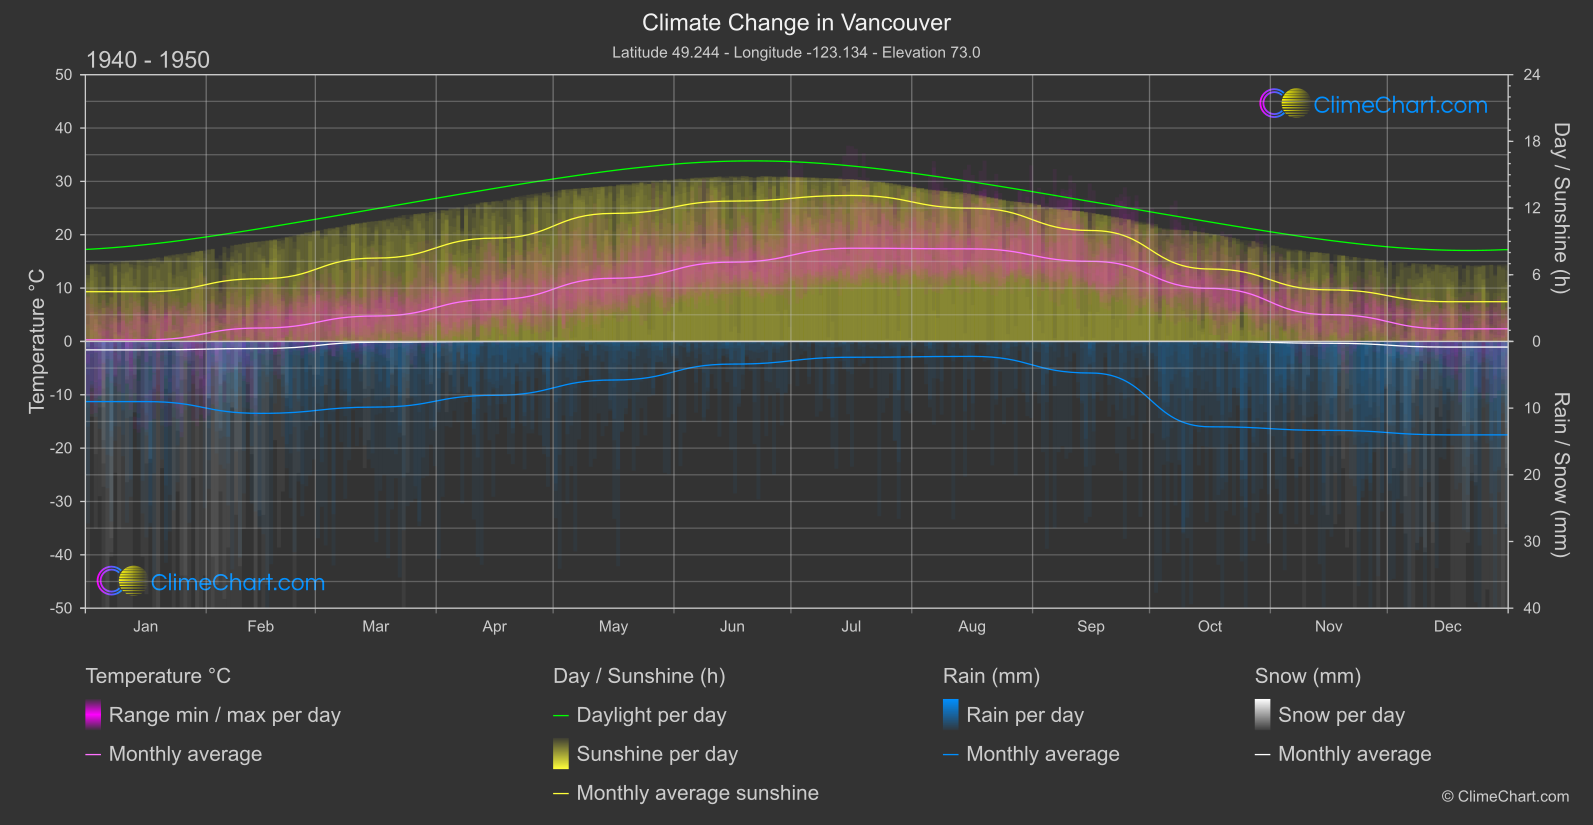
Vancouver, Canada, has experienced notable climate changes over the years. From temperature fluctuations to changes in rainfall and snowfall patterns, the data reveals interesting insights. For instance, the month with the highest temperature change is August, showing a significant increase in mean temperature. On the other hand, November experienced the highest change in rainfall, indicating a shift in precipitation levels. Understanding these climate shifts is crucial for adapting and mitigating the impacts of climate change in Vancouver.
Climate Change Data Overview for Vancouver, Canada
Explore the comprehensive climate change data for Vancouver, Canada. This detailed table provides valuable insights into temperature variations, precipitation levels, and seasonal changes influenced by climate change, helping you understand the unique weather patterns of this region.
Temperature °C
| Month | ⌀ 1940 - 1950 | ⌀ 2013 - 2023 | +/- |
|---|---|---|---|
| Jan | 0.30 | 3.94 | 3.64 |
| Feb | 2.52 | 3.51 | 0.99 |
| Mar | 4.77 | 5.99 | 1.22 |
| Apr | 7.87 | 8.62 | 0.75 |
| May | 11.84 | 13.06 | 1.22 |
| Jun | 14.87 | 15.82 | 0.95 |
| Jul | 17.47 | 18.67 | 1.20 |
| Aug | 17.35 | 18.96 | 1.61 |
| Sep | 15.01 | 15.31 | 0.30 |
| Oct | 9.95 | 10.64 | 0.70 |
| Nov | 5.03 | 6.24 | 1.21 |
| Dec | 2.36 | 3.30 | 0.94 |
| ⌀ Month | 9.11 | 10.34 | 1.23 |
Sunshine (h)
| Month | ⌀ 1940 - 1950 | ⌀ 2013 - 2023 | +/- |
|---|---|---|---|
| Jan | 4.47 | 3.69 | -0.79 |
| Feb | 5.64 | 5.08 | -0.56 |
| Mar | 7.50 | 6.83 | -0.67 |
| Apr | 9.29 | 8.84 | -0.45 |
| May | 11.52 | 11.35 | -0.18 |
| Jun | 12.63 | 12.05 | -0.58 |
| Jul | 13.13 | 13.03 | -0.10 |
| Aug | 11.99 | 11.79 | -0.19 |
| Sep | 9.98 | 8.99 | -0.99 |
| Oct | 6.52 | 6.28 | -0.24 |
| Nov | 4.64 | 4.24 | -0.40 |
| Dec | 3.58 | 3.19 | -0.38 |
| ⌀ Month | 8.41 | 7.95 | -0.46 |
Rain (mm)
| Month | ⌀ 1940 - 1950 | ⌀ 2013 - 2023 | +/- |
|---|---|---|---|
| Jan | 4.51 | 6.59 | 2.08 |
| Feb | 5.39 | 3.90 | -1.49 |
| Mar | 4.92 | 5.38 | 0.46 |
| Apr | 4.04 | 4.12 | 0.08 |
| May | 2.89 | 2.18 | -0.71 |
| Jun | 1.70 | 1.86 | 0.16 |
| Jul | 1.19 | 0.85 | -0.34 |
| Aug | 1.12 | 1.29 | 0.17 |
| Sep | 2.37 | 4.03 | 1.66 |
| Oct | 6.40 | 6.32 | -0.08 |
| Nov | 6.67 | 9.01 | 2.34 |
| Dec | 7.01 | 6.76 | -0.25 |
| ⌀ Month | 4.02 | 4.36 | 0.34 |
Snow (mm)
| Month | ⌀ 1940 - 1950 | ⌀ 2013 - 2023 | +/- |
|---|---|---|---|
| Jan | 0.63 | 0.37 | -0.27 |
| Feb | 0.53 | 0.61 | 0.09 |
| Mar | 0.06 | 0.15 | 0.09 |
| Apr | 0.01 | 0.05 | 0.04 |
| May | 0.00 | 0.00 | 0.00 |
| Jun | 0.00 | 0.00 | 0.00 |
| Jul | 0.00 | 0.00 | 0.00 |
| Aug | 0.00 | 0.00 | 0.00 |
| Sep | 0.00 | 0.00 | 0.00 |
| Oct | 0.00 | 0.00 | 0.00 |
| Nov | 0.14 | 0.09 | -0.04 |
| Dec | 0.42 | 0.55 | 0.12 |
| ⌀ Month | 0.15 | 0.15 | 0.00 |