Climate Change Chart of Calgary, Canada
Comprehensive Climate Change Chart of Calgary, Canada: Monthly Averages and Impact Trends
Exploring the changing climate in Calgary, Canada reveals intriguing insights.
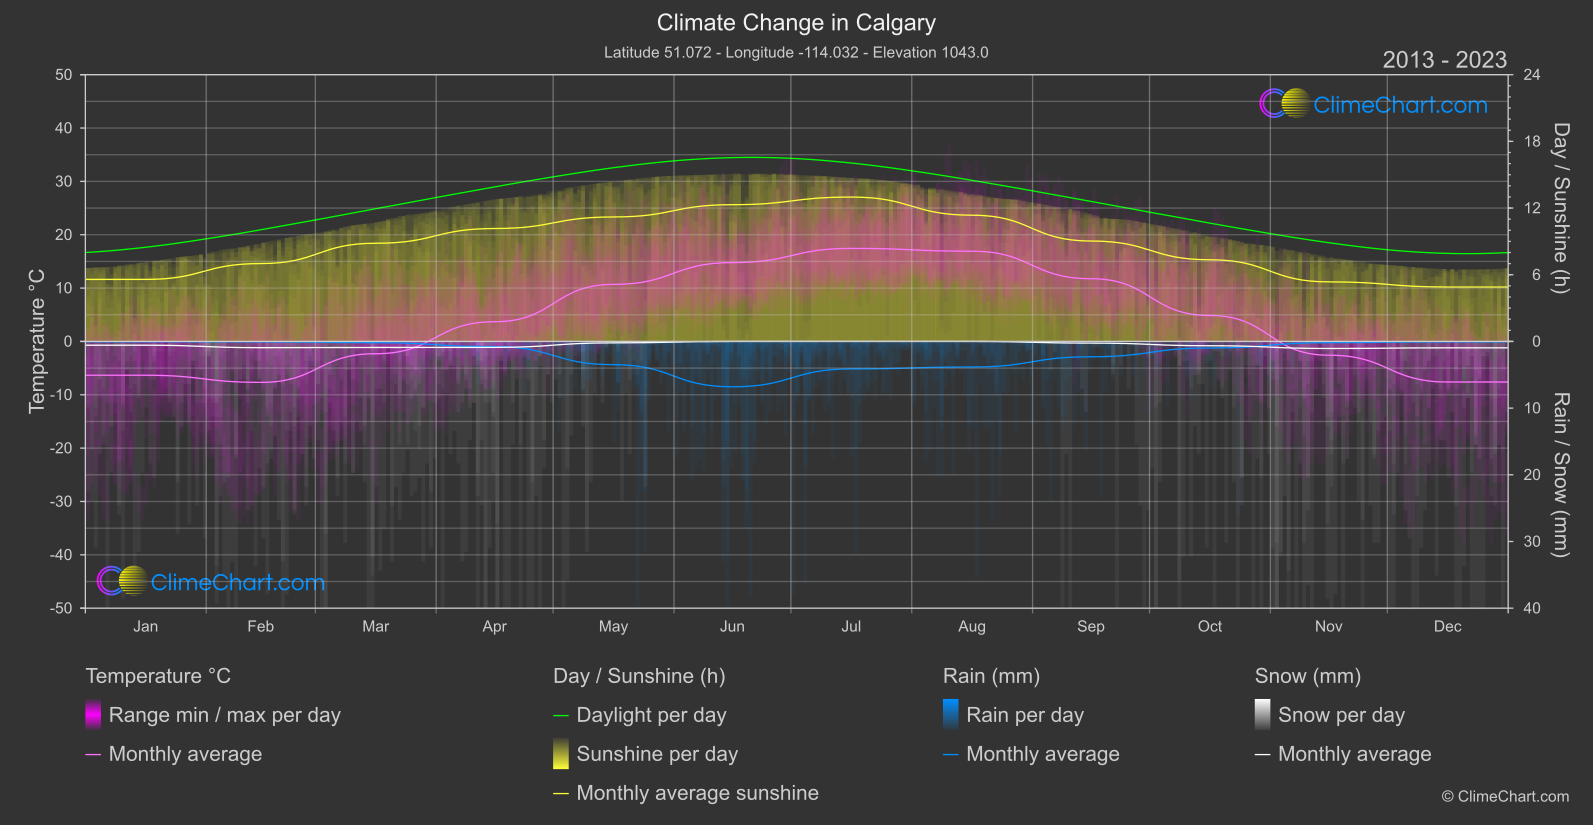
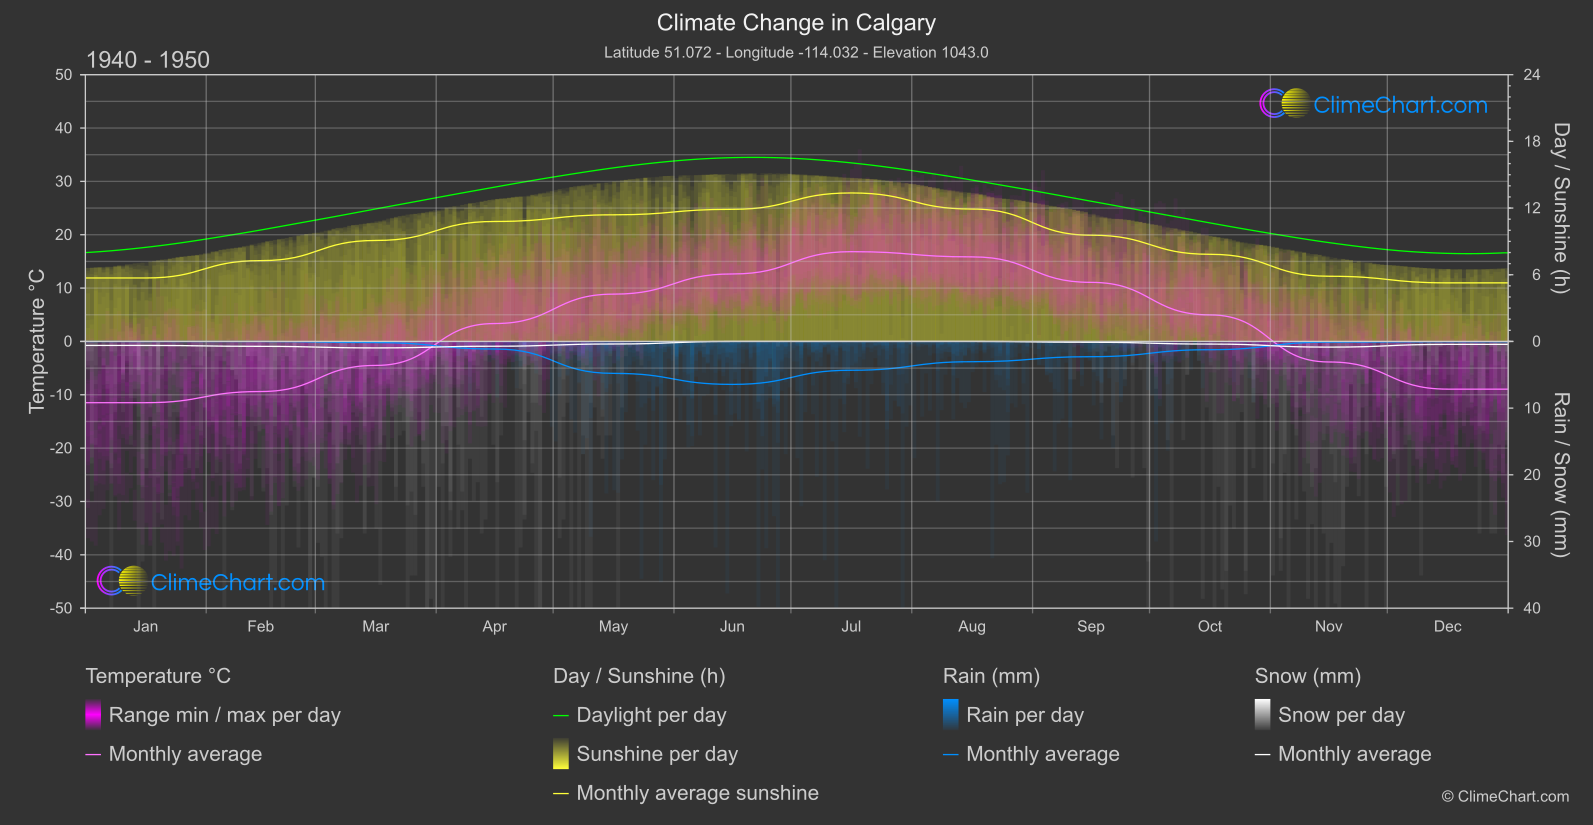
Calgary, Canada, has experienced notable changes in temperature, rainfall, snowfall, and sunshine duration over the years. When comparing the data from 1940-1950 to 2013-2024, it's evident that certain months have seen significant shifts. For example, January has shown a temperature increase of 5.14°C, while August has seen a rise of 1.06°C. In terms of rainfall, May has experienced a decrease of 0.65mm, and October has had a reduction of 0.13mm. Snowfall has also fluctuated, with December experiencing a notable increase of 0.26mm. Moreover, sunshine duration has varied, with June having a rise of 0.41 hours, whereas April has seen a decrease of 0.63 hours.
Climate Change Data Overview for Calgary, Canada
Explore the comprehensive climate change data for Calgary, Canada. This detailed table provides valuable insights into temperature variations, precipitation levels, and seasonal changes influenced by climate change, helping you understand the unique weather patterns of this region.
Temperature °C
| Month | ⌀ 1940 - 1950 | ⌀ 2013 - 2023 | +/- |
|---|---|---|---|
| Jan | -11.48 | -6.34 | 5.14 |
| Feb | -9.39 | -7.68 | 1.71 |
| Mar | -4.50 | -2.30 | 2.20 |
| Apr | 3.35 | 3.69 | 0.34 |
| May | 8.87 | 10.69 | 1.83 |
| Jun | 12.65 | 14.78 | 2.13 |
| Jul | 16.83 | 17.44 | 0.62 |
| Aug | 15.85 | 16.91 | 1.06 |
| Sep | 11.07 | 11.76 | 0.69 |
| Oct | 4.97 | 4.86 | -0.11 |
| Nov | -3.85 | -2.58 | 1.27 |
| Dec | -8.94 | -7.60 | 1.34 |
| ⌀ Month | 2.95 | 4.47 | 1.52 |
Sunshine (h)
| Month | ⌀ 1940 - 1950 | ⌀ 2013 - 2023 | +/- |
|---|---|---|---|
| Jan | 5.71 | 5.58 | -0.13 |
| Feb | 7.27 | 7.01 | -0.27 |
| Mar | 9.08 | 8.83 | -0.25 |
| Apr | 10.79 | 10.16 | -0.63 |
| May | 11.39 | 11.20 | -0.19 |
| Jun | 11.89 | 12.30 | 0.41 |
| Jul | 13.36 | 12.99 | -0.37 |
| Aug | 11.91 | 11.36 | -0.55 |
| Sep | 9.56 | 9.03 | -0.53 |
| Oct | 7.84 | 7.35 | -0.49 |
| Nov | 5.86 | 5.36 | -0.51 |
| Dec | 5.27 | 4.90 | -0.37 |
| ⌀ Month | 9.16 | 8.84 | -0.32 |
Rain (mm)
| Month | ⌀ 1940 - 1950 | ⌀ 2013 - 2023 | +/- |
|---|---|---|---|
| Jan | 0.01 | 0.02 | 0.02 |
| Feb | 0.00 | 0.03 | 0.03 |
| Mar | 0.09 | 0.09 | 0.01 |
| Apr | 0.57 | 0.39 | -0.17 |
| May | 2.39 | 1.74 | -0.65 |
| Jun | 3.22 | 3.40 | 0.18 |
| Jul | 2.16 | 2.06 | -0.10 |
| Aug | 1.52 | 1.92 | 0.40 |
| Sep | 1.14 | 1.15 | 0.01 |
| Oct | 0.62 | 0.49 | -0.13 |
| Nov | 0.05 | 0.09 | 0.04 |
| Dec | 0.02 | 0.03 | 0.02 |
| ⌀ Month | 0.98 | 0.95 | -0.03 |
Snow (mm)
| Month | ⌀ 1940 - 1950 | ⌀ 2013 - 2023 | +/- |
|---|---|---|---|
| Jan | 0.30 | 0.28 | -0.02 |
| Feb | 0.37 | 0.47 | 0.10 |
| Mar | 0.48 | 0.45 | -0.03 |
| Apr | 0.36 | 0.45 | 0.09 |
| May | 0.19 | 0.11 | -0.08 |
| Jun | 0.00 | 0.00 | -0.00 |
| Jul | 0.00 | 0.00 | 0.00 |
| Aug | 0.00 | 0.00 | 0.00 |
| Sep | 0.06 | 0.13 | 0.06 |
| Oct | 0.20 | 0.32 | 0.13 |
| Nov | 0.43 | 0.53 | 0.10 |
| Dec | 0.22 | 0.48 | 0.26 |
| ⌀ Month | 0.22 | 0.27 | 0.05 |