Climate Change Chart of Banff National Park, Canada
Comprehensive Climate Change Chart of Banff National Park, Canada: Monthly Averages and Impact Trends
Explore the changing climate in Banff National Park, Canada, through comprehensive data analysis.
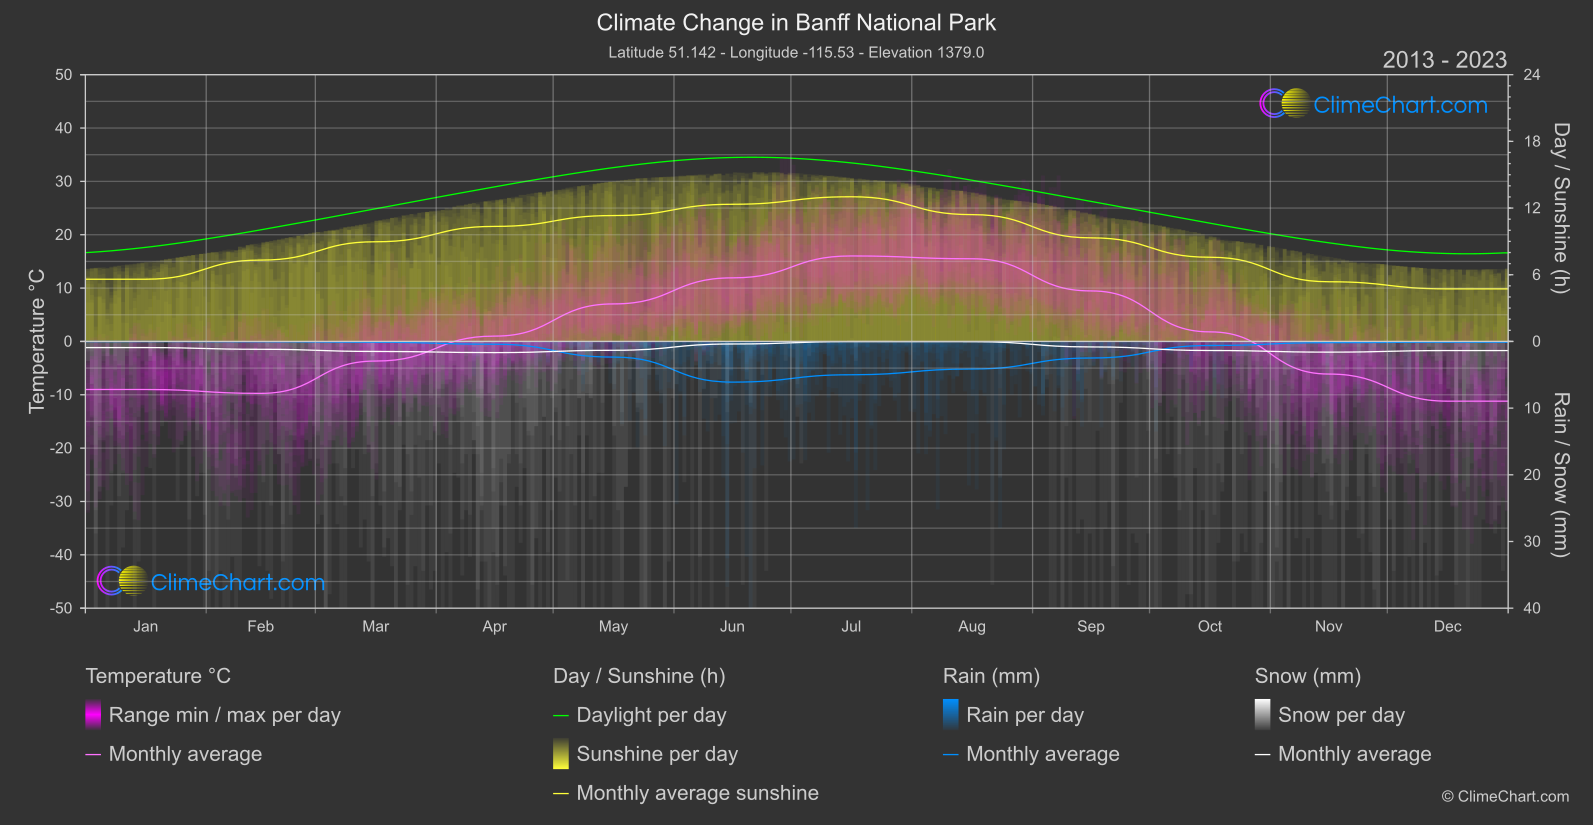
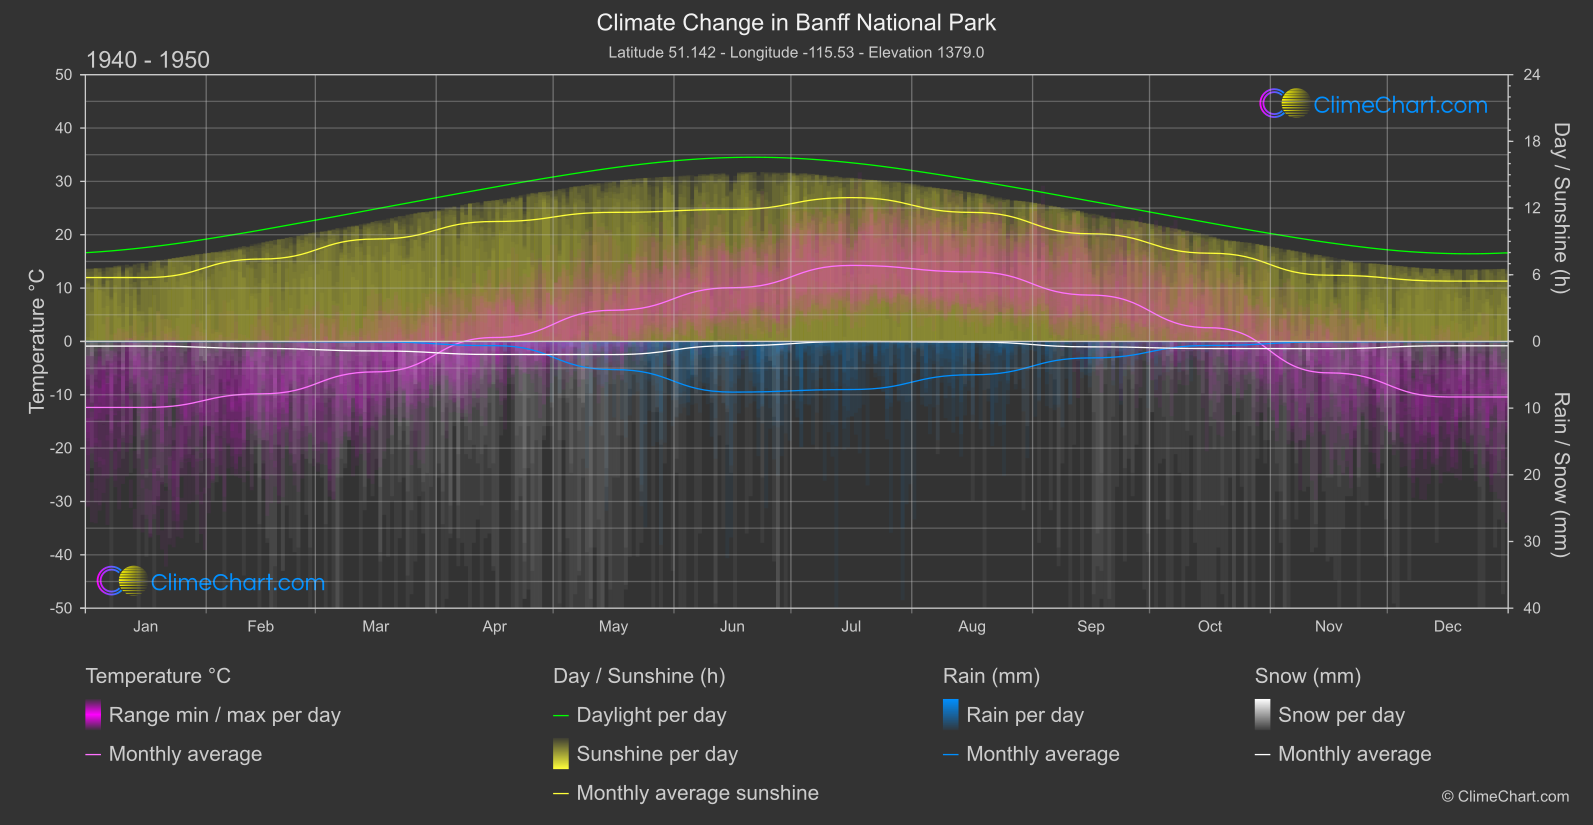
Banff National Park in Canada experiences notable climate changes over the years. From temperature fluctuations to shifts in rainfall and snowfall patterns, the data reveals intriguing insights. For instance, the month of March shows a significant increase in temperature compared to the historical period, while July experiences a decrease in rainfall. These shifts in climate parameters highlight the ongoing impact of climate change in the region.
Climate Change Data Overview for Banff National Park, Canada
Explore the comprehensive climate change data for Banff National Park, Canada. This detailed table provides valuable insights into temperature variations, precipitation levels, and seasonal changes influenced by climate change, helping you understand the unique weather patterns of this region.
Temperature °C
| Month | ⌀ 1940 - 1950 | ⌀ 2013 - 2023 | +/- |
|---|---|---|---|
| Jan | -12.37 | -9.01 | 3.36 |
| Feb | -9.83 | -9.74 | 0.09 |
| Mar | -5.70 | -3.68 | 2.03 |
| Apr | 0.74 | 1.00 | 0.26 |
| May | 5.84 | 7.03 | 1.19 |
| Jun | 10.07 | 11.92 | 1.85 |
| Jul | 14.25 | 16.02 | 1.77 |
| Aug | 13.04 | 15.50 | 2.45 |
| Sep | 8.68 | 9.47 | 0.79 |
| Oct | 2.57 | 1.79 | -0.77 |
| Nov | -5.89 | -6.11 | -0.22 |
| Dec | -10.41 | -11.20 | -0.79 |
| ⌀ Month | 0.92 | 1.92 | 1.00 |
Sunshine (h)
| Month | ⌀ 1940 - 1950 | ⌀ 2013 - 2023 | +/- |
|---|---|---|---|
| Jan | 5.75 | 5.60 | -0.15 |
| Feb | 7.41 | 7.32 | -0.09 |
| Mar | 9.21 | 8.97 | -0.24 |
| Apr | 10.79 | 10.35 | -0.44 |
| May | 11.61 | 11.33 | -0.29 |
| Jun | 11.87 | 12.34 | 0.47 |
| Jul | 12.94 | 13.02 | 0.08 |
| Aug | 11.61 | 11.41 | -0.20 |
| Sep | 9.68 | 9.32 | -0.36 |
| Oct | 7.94 | 7.57 | -0.36 |
| Nov | 5.96 | 5.37 | -0.59 |
| Dec | 5.43 | 4.73 | -0.70 |
| ⌀ Month | 9.18 | 8.94 | -0.24 |
Rain (mm)
| Month | ⌀ 1940 - 1950 | ⌀ 2013 - 2023 | +/- |
|---|---|---|---|
| Jan | 0.00 | 0.01 | 0.00 |
| Feb | 0.00 | 0.02 | 0.02 |
| Mar | 0.03 | 0.06 | 0.03 |
| Apr | 0.31 | 0.21 | -0.11 |
| May | 2.11 | 1.17 | -0.94 |
| Jun | 3.80 | 3.05 | -0.75 |
| Jul | 3.61 | 2.50 | -1.11 |
| Aug | 2.50 | 2.07 | -0.43 |
| Sep | 1.23 | 1.24 | 0.01 |
| Oct | 0.30 | 0.30 | 0.00 |
| Nov | 0.03 | 0.09 | 0.07 |
| Dec | 0.01 | 0.06 | 0.05 |
| ⌀ Month | 1.16 | 0.90 | -0.26 |
Snow (mm)
| Month | ⌀ 1940 - 1950 | ⌀ 2013 - 2023 | +/- |
|---|---|---|---|
| Jan | 0.35 | 0.46 | 0.11 |
| Feb | 0.53 | 0.59 | 0.06 |
| Mar | 0.71 | 0.75 | 0.04 |
| Apr | 0.98 | 0.84 | -0.14 |
| May | 0.98 | 0.66 | -0.32 |
| Jun | 0.32 | 0.19 | -0.13 |
| Jul | 0.01 | 0.01 | 0.00 |
| Aug | 0.05 | 0.02 | -0.03 |
| Sep | 0.41 | 0.41 | 0.00 |
| Oct | 0.53 | 0.68 | 0.15 |
| Nov | 0.54 | 0.80 | 0.26 |
| Dec | 0.32 | 0.68 | 0.36 |
| ⌀ Month | 0.48 | 0.51 | 0.03 |