Climate Chart of Quebec City, Canada
Comprehensive Climate Chart of Quebec City, Canada: Monthly Averages and Weather Trends
Welcome to Quebec City, Canada! Discover the climate and weather information for this charming city.
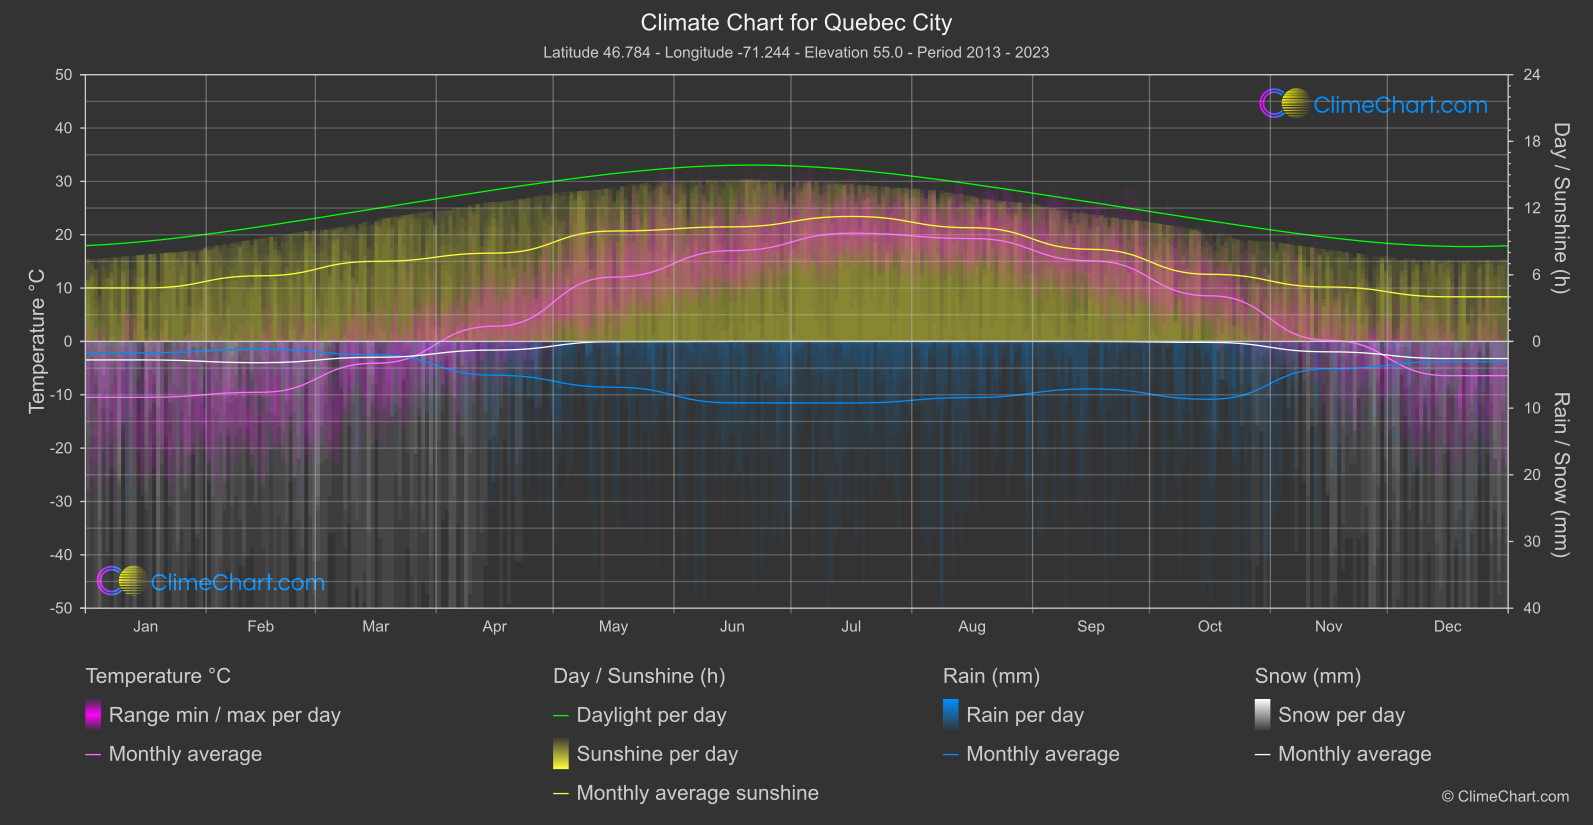
Quebec City experiences a continental climate with cold, snowy winters and warm summers. The average temperature in winter ranges from -8°C to -15°C, while in summer, it ranges from 17°C to 26°C. The city receives significant snowfall, making it a winter wonderland.
Best Travel Time Guide for Quebec City, Canada: Ideal Seasons and Weather Insights
The best time to travel to Quebec City is during the summer months from June to August when the weather is pleasant for outdoor activities. Winter is also a popular time to visit for those looking to experience the city covered in snow and festive holiday atmosphere.
Climate Data Overview for Quebec City, Canada
Explore the comprehensive climate data for Quebec City, Canada. This detailed table provides valuable insights into temperature variations, precipitation levels, and seasonal changes, helping you understand the unique weather patterns of this region.
| Month | ⌀ Temperature °C | ⌀ Rain (mm) | ⌀ Snow (mm) | ⌀ Sunshine (h) |
|---|---|---|---|---|
| Jan | -10.5 | 0.85 | 1.39 | 4.81 |
| Feb | -9.5 | 0.58 | 1.59 | 5.90 |
| Mar | -4.1 | 1.00 | 1.19 | 7.20 |
| Apr | 2.8 | 2.54 | 0.65 | 7.94 |
| May | 12.1 | 3.43 | 0.02 | 9.93 |
| Jun | 17.0 | 4.61 | 0.00 | 10.31 |
| Jul | 20.3 | 4.62 | 0.00 | 11.24 |
| Aug | 19.3 | 4.21 | 0.00 | 10.23 |
| Sep | 15.1 | 3.56 | 0.00 | 8.29 |
| Oct | 8.6 | 4.33 | 0.07 | 6.04 |
| Nov | 0.2 | 2.05 | 0.78 | 4.89 |
| Dec | -6.4 | 1.52 | 1.28 | 4.02 |
| ⌀ Month | 5.4 | 2.77 | 0.58 | 7.57 |