Climate Change Chart of Paris, France
Comprehensive Climate Change Chart of Paris, France: Monthly Averages and Impact Trends
Exploring the changing climate in Paris, France reveals intriguing insights into temperature, rainfall, snowfall, and sunshine duration over the years. Let's delve into the data to uncover trends and patterns.
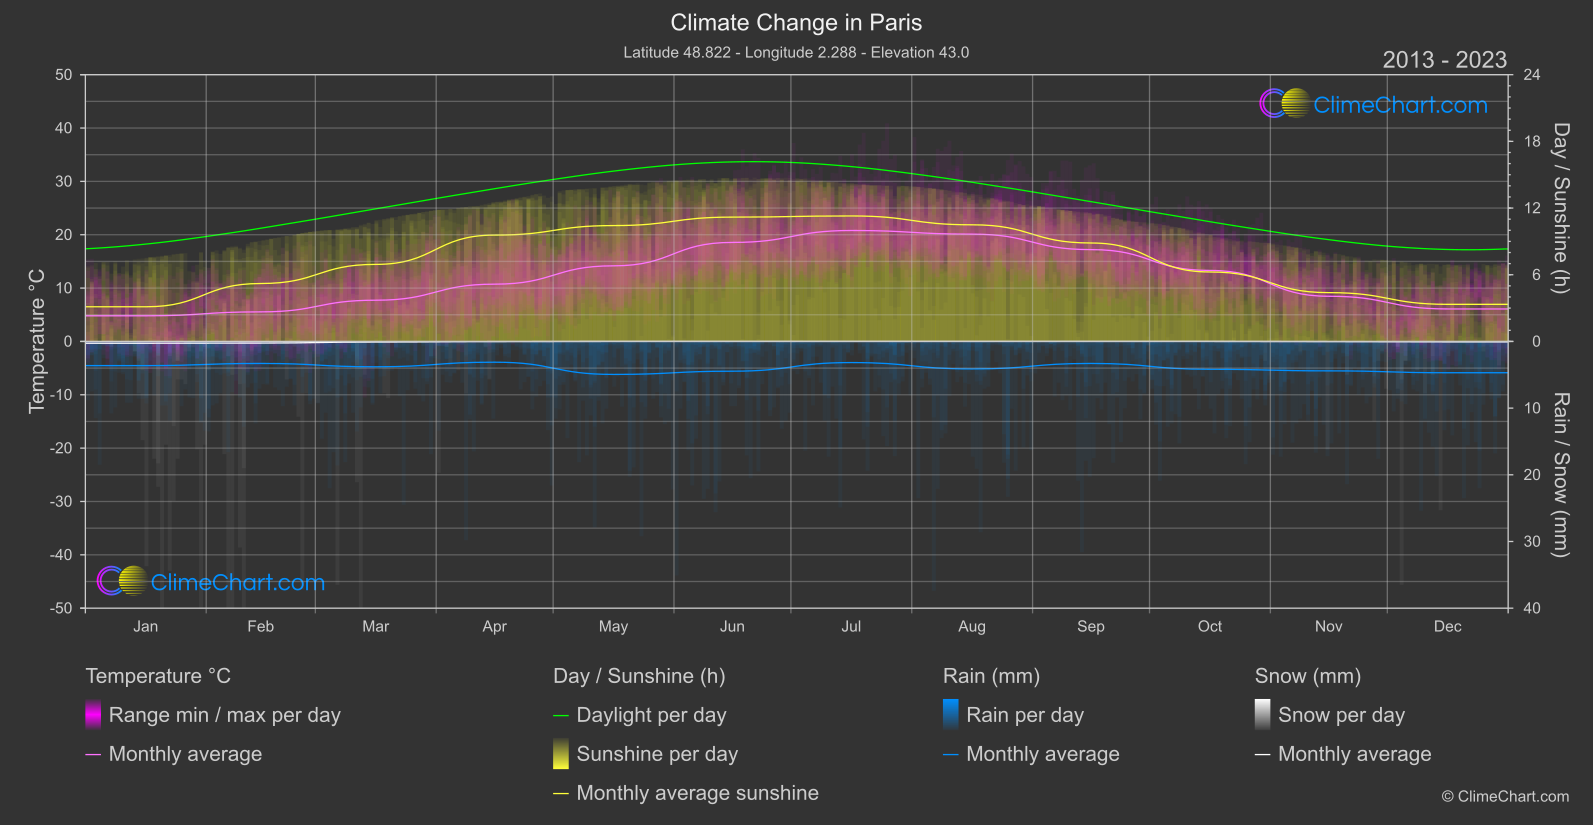
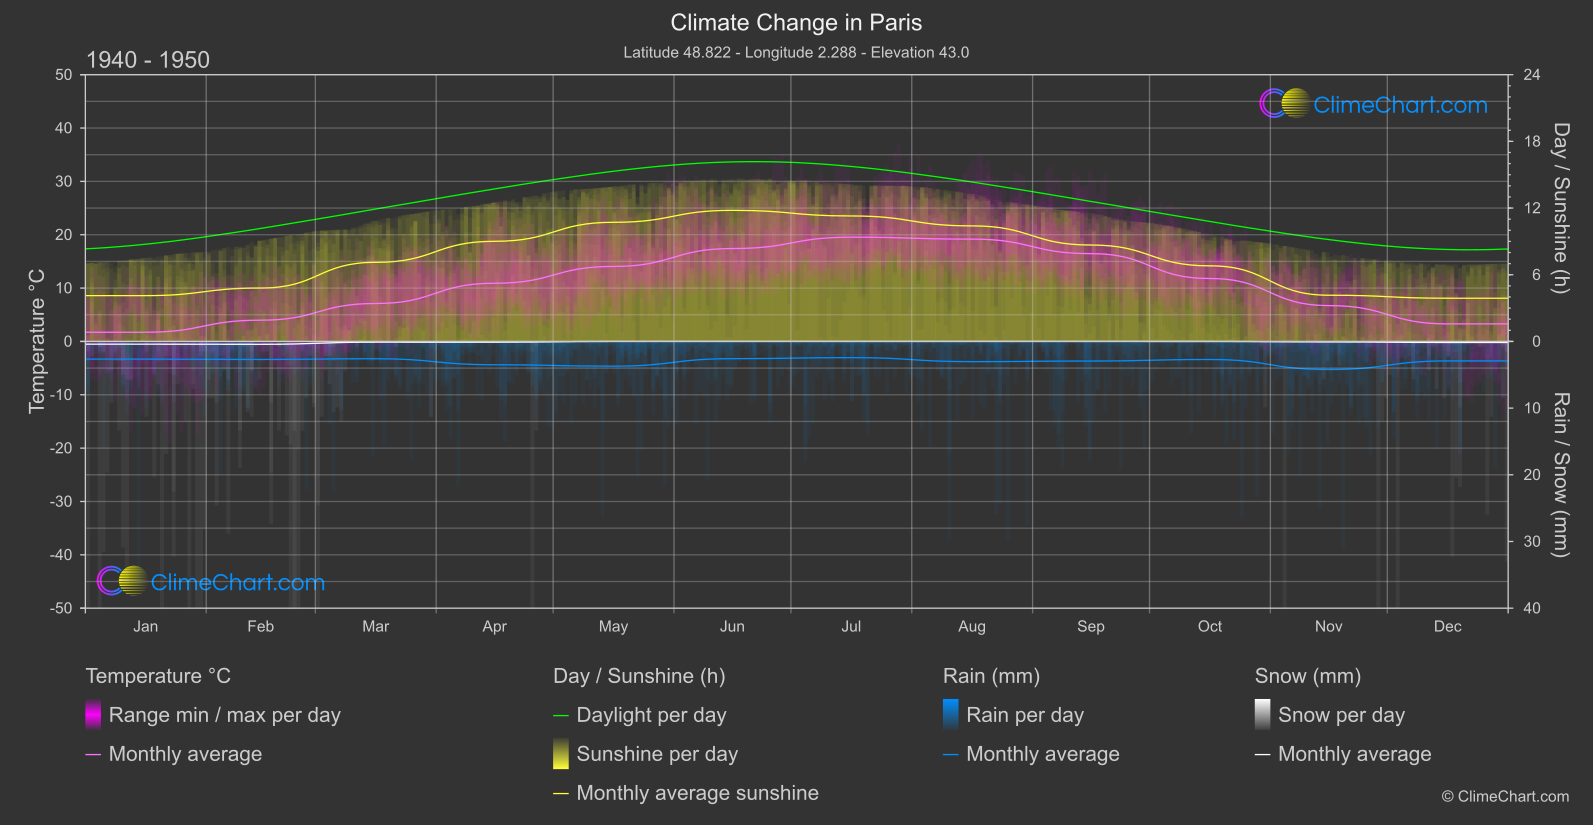
Paris, the capital city of France, has experienced notable changes in its climate over the years. Analyzing the temperature data from 1940-1950 compared to 2013-2024, we find that the month with the highest temperature change is March, with an increase of 3.08°C. In terms of rainfall, May stands out with a significant increase of 0.62 mm. Snowfall has decreased overall, with November experiencing the most substantial reduction of 0.024 mm. Additionally, sunshine duration has seen fluctuations, with June showing a decrease of 0.61 hours. These insights shed light on the evolving climate patterns in Paris.
Climate Change Data Overview for Paris, France
Explore the comprehensive climate change data for Paris, France. This detailed table provides valuable insights into temperature variations, precipitation levels, and seasonal changes influenced by climate change, helping you understand the unique weather patterns of this region.
Temperature °C
| Month | ⌀ 1940 - 1950 | ⌀ 2013 - 2023 | +/- |
|---|---|---|---|
| Jan | 1.73 | 4.80 | 3.08 |
| Feb | 3.98 | 5.54 | 1.56 |
| Mar | 7.11 | 7.73 | 0.62 |
| Apr | 10.91 | 10.73 | -0.17 |
| May | 14.06 | 14.17 | 0.11 |
| Jun | 17.41 | 18.56 | 1.15 |
| Jul | 19.54 | 20.79 | 1.25 |
| Aug | 19.18 | 20.11 | 0.93 |
| Sep | 16.46 | 17.21 | 0.75 |
| Oct | 11.79 | 13.31 | 1.51 |
| Nov | 6.72 | 8.47 | 1.75 |
| Dec | 3.28 | 6.09 | 2.80 |
| ⌀ Month | 11.01 | 12.29 | 1.28 |
Sunshine (h)
| Month | ⌀ 1940 - 1950 | ⌀ 2013 - 2023 | +/- |
|---|---|---|---|
| Jan | 4.12 | 3.12 | -1.00 |
| Feb | 4.80 | 5.21 | 0.41 |
| Mar | 7.12 | 6.93 | -0.19 |
| Apr | 9.01 | 9.57 | 0.56 |
| May | 10.72 | 10.42 | -0.30 |
| Jun | 11.79 | 11.19 | -0.61 |
| Jul | 11.29 | 11.29 | 0.00 |
| Aug | 10.40 | 10.49 | 0.10 |
| Sep | 8.67 | 8.86 | 0.18 |
| Oct | 6.80 | 6.25 | -0.55 |
| Nov | 4.16 | 4.39 | 0.23 |
| Dec | 3.89 | 3.34 | -0.55 |
| ⌀ Month | 7.73 | 7.59 | -0.14 |
Rain (mm)
| Month | ⌀ 1940 - 1950 | ⌀ 2013 - 2023 | +/- |
|---|---|---|---|
| Jan | 1.33 | 1.81 | 0.49 |
| Feb | 1.35 | 1.65 | 0.30 |
| Mar | 1.30 | 1.90 | 0.60 |
| Apr | 1.75 | 1.56 | -0.19 |
| May | 1.85 | 2.47 | 0.62 |
| Jun | 1.29 | 2.23 | 0.94 |
| Jul | 1.21 | 1.59 | 0.37 |
| Aug | 1.51 | 2.06 | 0.55 |
| Sep | 1.47 | 1.65 | 0.18 |
| Oct | 1.35 | 2.09 | 0.73 |
| Nov | 2.10 | 2.21 | 0.10 |
| Dec | 1.46 | 2.35 | 0.89 |
| ⌀ Month | 1.50 | 1.96 | 0.46 |
Snow (mm)
| Month | ⌀ 1940 - 1950 | ⌀ 2013 - 2023 | +/- |
|---|---|---|---|
| Jan | 0.21 | 0.13 | -0.07 |
| Feb | 0.21 | 0.12 | -0.09 |
| Mar | 0.06 | 0.04 | -0.01 |
| Apr | 0.06 | 0.01 | -0.04 |
| May | 0.00 | 0.00 | 0.00 |
| Jun | 0.00 | 0.00 | 0.00 |
| Jul | 0.00 | 0.00 | 0.00 |
| Aug | 0.00 | 0.00 | 0.00 |
| Sep | 0.00 | 0.00 | 0.00 |
| Oct | 0.00 | 0.00 | -0.00 |
| Nov | 0.04 | 0.01 | -0.02 |
| Dec | 0.08 | 0.03 | -0.05 |
| ⌀ Month | 0.05 | 0.03 | -0.02 |