Climate Chart of Mexico City, Mexico
Comprehensive Climate Chart of Mexico City, Mexico: Monthly Averages and Weather Trends
Welcome to Mexico City, Mexico!
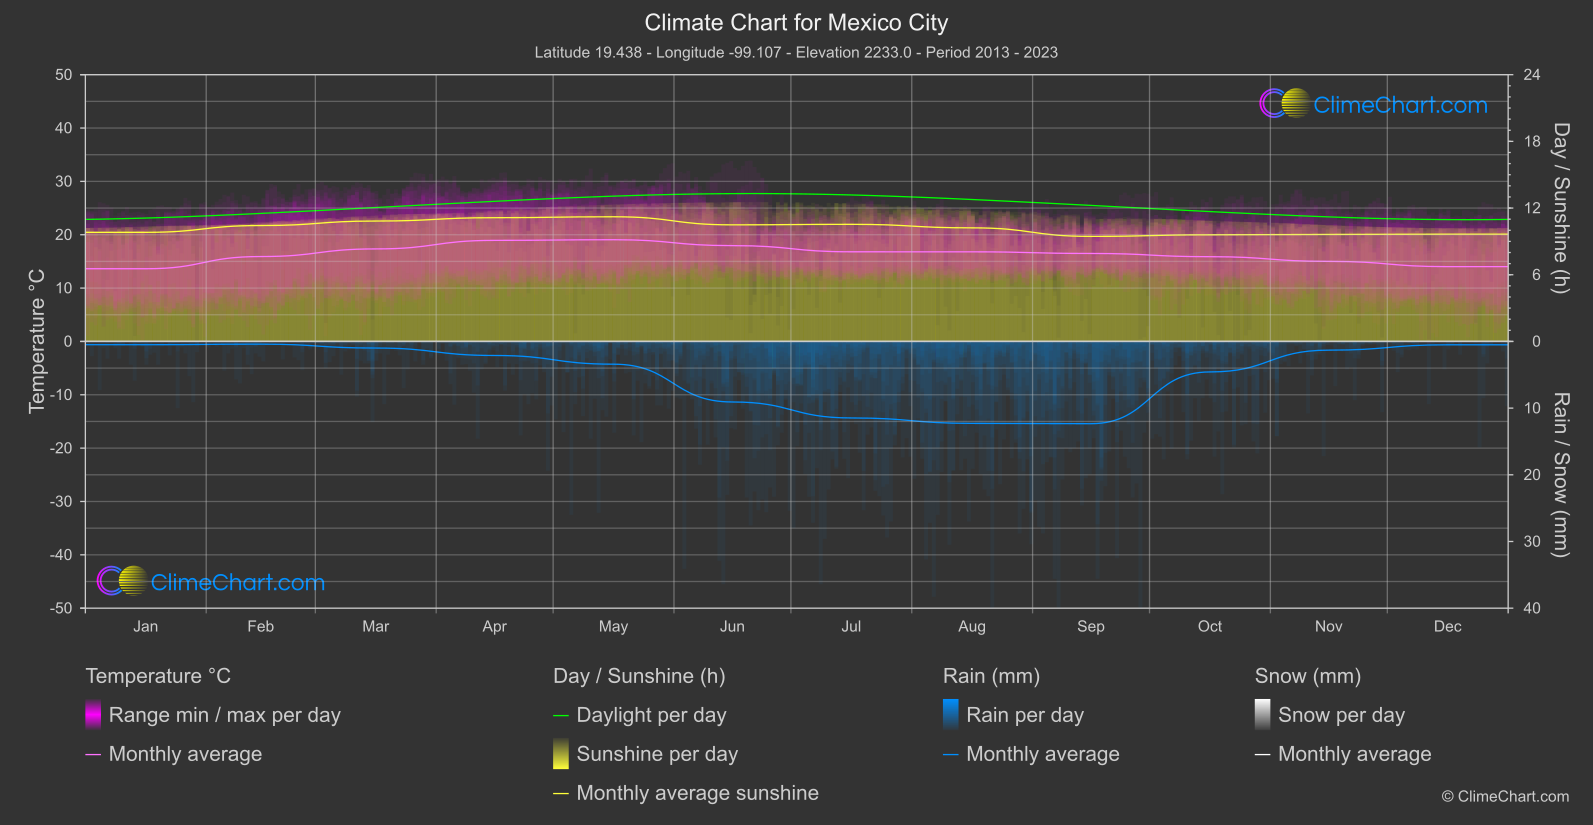
Mexico City, the capital of Mexico, is located at a high altitude which gives it a mild and pleasant climate throughout the year. The city experiences a subtropical highland climate with dry winters and rainy summers. The average temperature ranges from 12°C to 22°C, making it an ideal destination for travelers seeking comfortable weather. The rainy season usually occurs from May to October, with the heaviest rainfall in July and August.
Best Travel Time Guide for Mexico City, Mexico: Ideal Seasons and Weather Insights
The best time to visit Mexico City is during the dry season from November to April when the weather is mild and there is less rainfall. This period offers pleasant temperatures and clear skies, ideal for exploring the city's attractions and outdoor activities. However, if you prefer the vibrant atmosphere of the rainy season, visiting from May to October can also be a unique experience, but be prepared for occasional showers.
Climate Data Overview for Mexico City, Mexico
Explore the comprehensive climate data for Mexico City, Mexico. This detailed table provides valuable insights into temperature variations, precipitation levels, and seasonal changes, helping you understand the unique weather patterns of this region.
| Month | ⌀ Temperature °C | ⌀ Rain (mm) | ⌀ Snow (mm) | ⌀ Sunshine (h) |
|---|---|---|---|---|
| Jan | 13.6 | 0.25 | 0.00 | 9.82 |
| Feb | 15.9 | 0.20 | 0.00 | 10.43 |
| Mar | 17.3 | 0.50 | 0.00 | 10.83 |
| Apr | 18.9 | 1.05 | 0.00 | 11.13 |
| May | 19.1 | 1.71 | 0.00 | 11.22 |
| Jun | 18.0 | 4.54 | 0.00 | 10.49 |
| Jul | 16.8 | 5.74 | 0.00 | 10.54 |
| Aug | 16.8 | 6.14 | 0.00 | 10.22 |
| Sep | 16.5 | 6.17 | 0.00 | 9.45 |
| Oct | 15.9 | 2.29 | 0.00 | 9.59 |
| Nov | 15.0 | 0.65 | 0.00 | 9.63 |
| Dec | 14.0 | 0.25 | 0.00 | 9.65 |
| ⌀ Month | 16.5 | 2.46 | 0.00 | 10.25 |