Climate Change Chart of Whitehorse, Canada
Comprehensive Climate Change Chart of Whitehorse, Canada: Monthly Averages and Impact Trends
Explore the changing climate in Whitehorse, Canada, with insights from temperature, rainfall, snowfall, and sunshine duration data.
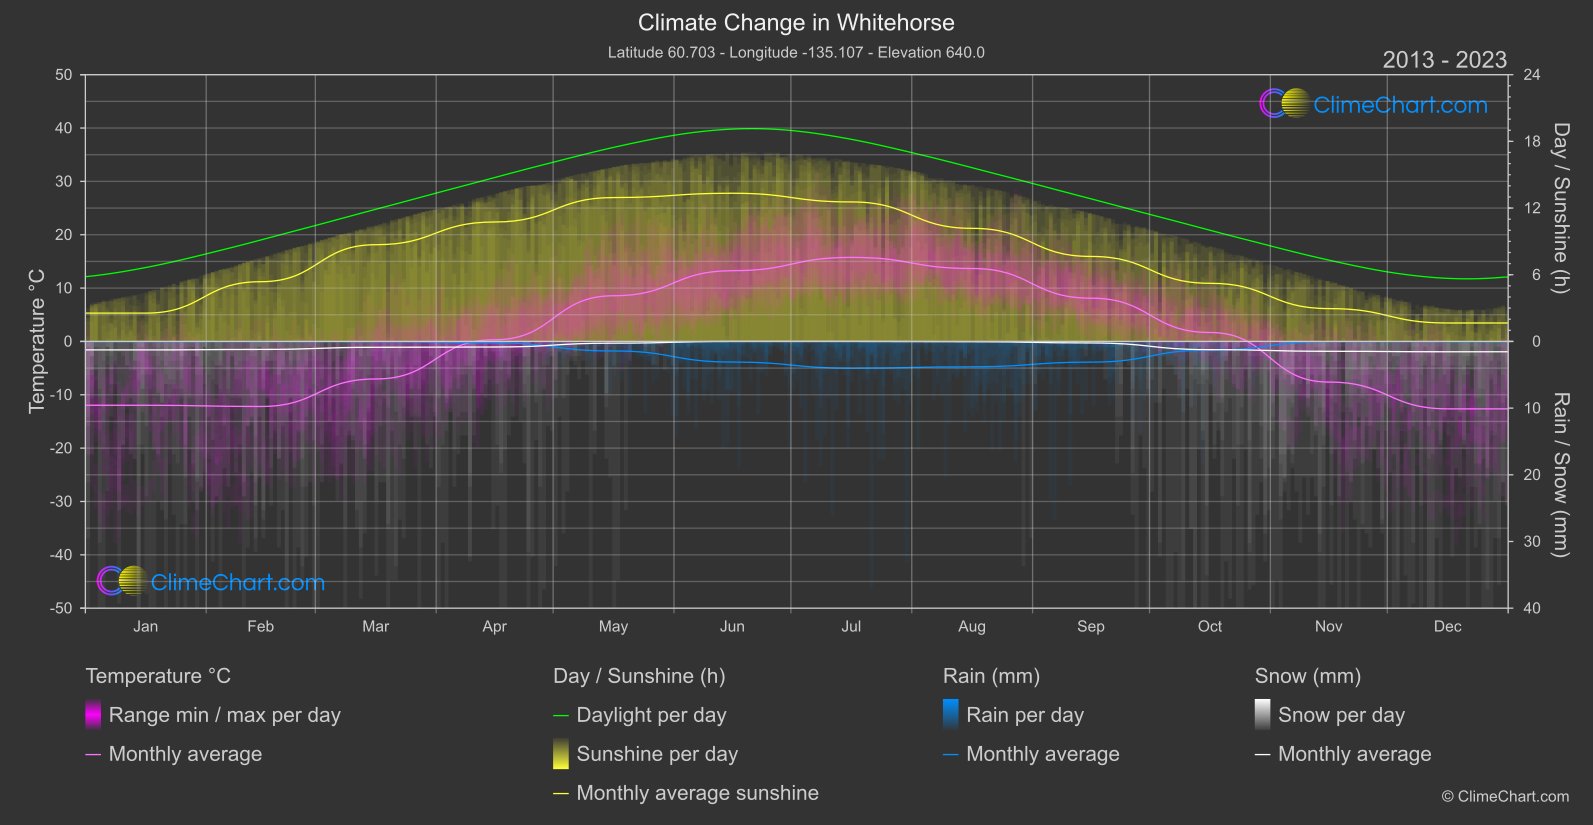
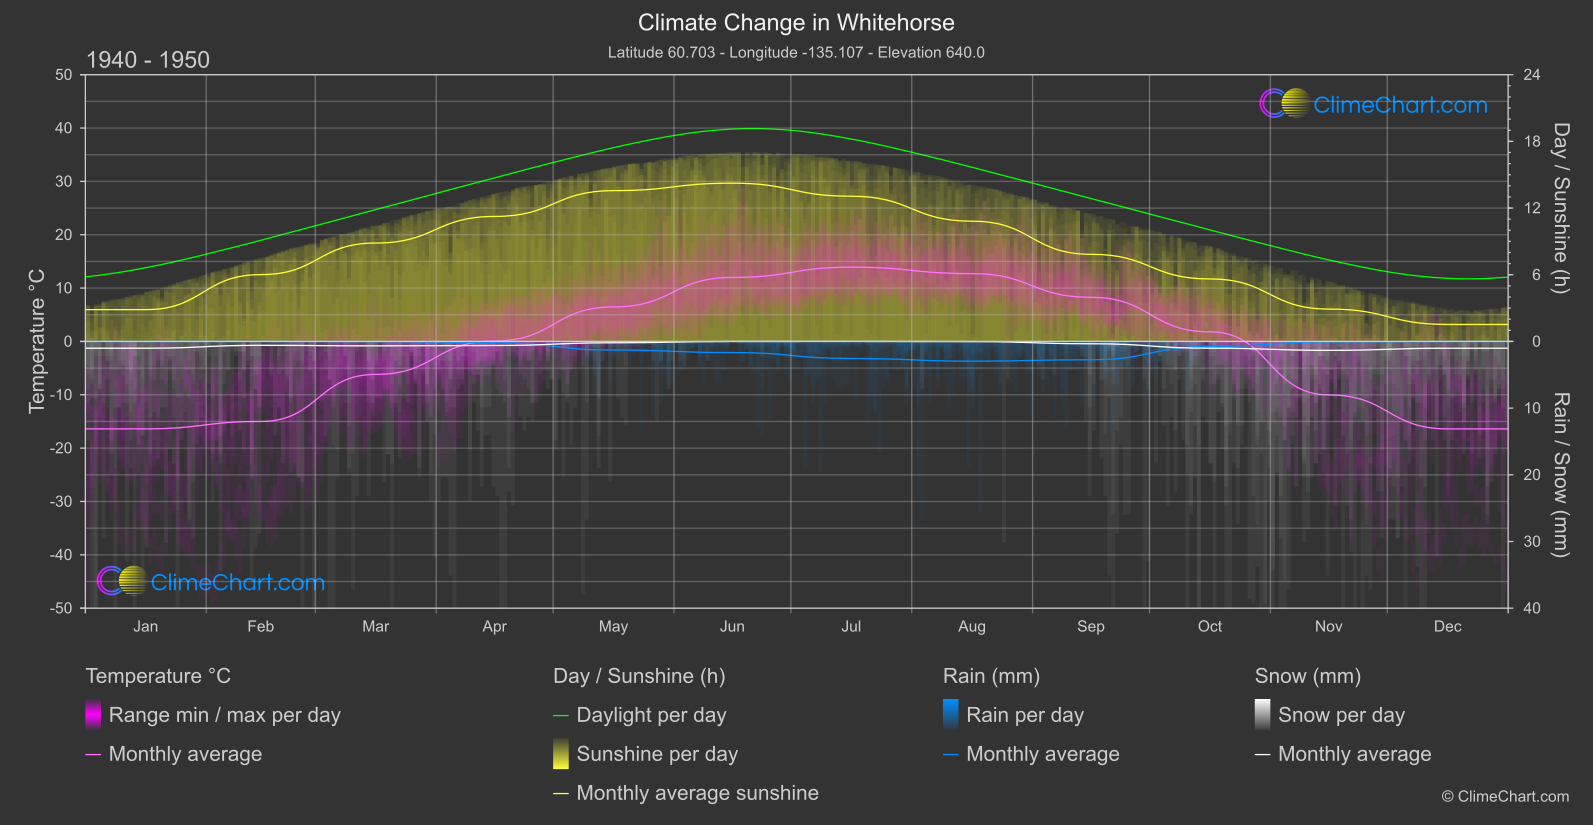
Whitehorse, Canada, experiences significant changes in temperature, rainfall, snowfall, and sunshine duration over the years. Analysis of the data reveals interesting patterns, such as the month of June showing the highest increase in temperature and the month of June experiencing the most significant rise in rainfall. These insights provide valuable information about the evolving climate conditions in Whitehorse, aiding in understanding the impact of climate change.
Climate Change Data Overview for Whitehorse, Canada
Explore the comprehensive climate change data for Whitehorse, Canada. This detailed table provides valuable insights into temperature variations, precipitation levels, and seasonal changes influenced by climate change, helping you understand the unique weather patterns of this region.
Temperature °C
| Month | ⌀ 1940 - 1950 | ⌀ 2013 - 2023 | +/- |
|---|---|---|---|
| Jan | -16.38 | -11.96 | 4.42 |
| Feb | -15.00 | -12.19 | 2.81 |
| Mar | -6.18 | -7.04 | -0.86 |
| Apr | 0.09 | 0.32 | 0.24 |
| May | 6.47 | 8.56 | 2.10 |
| Jun | 12.00 | 13.26 | 1.26 |
| Jul | 13.92 | 15.75 | 1.83 |
| Aug | 12.71 | 13.67 | 0.96 |
| Sep | 8.27 | 8.11 | -0.16 |
| Oct | 1.80 | 1.68 | -0.12 |
| Nov | -10.03 | -7.62 | 2.41 |
| Dec | -16.40 | -12.64 | 3.76 |
| ⌀ Month | -0.73 | 0.83 | 1.55 |
Sunshine (h)
| Month | ⌀ 1940 - 1950 | ⌀ 2013 - 2023 | +/- |
|---|---|---|---|
| Jan | 2.86 | 2.55 | -0.31 |
| Feb | 6.01 | 5.37 | -0.64 |
| Mar | 8.85 | 8.70 | -0.15 |
| Apr | 11.25 | 10.75 | -0.50 |
| May | 13.57 | 12.94 | -0.62 |
| Jun | 14.24 | 13.33 | -0.91 |
| Jul | 13.07 | 12.55 | -0.51 |
| Aug | 10.82 | 10.17 | -0.64 |
| Sep | 7.84 | 7.65 | -0.19 |
| Oct | 5.62 | 5.23 | -0.39 |
| Nov | 2.91 | 2.95 | 0.04 |
| Dec | 1.53 | 1.66 | 0.13 |
| ⌀ Month | 8.21 | 7.82 | -0.39 |
Rain (mm)
| Month | ⌀ 1940 - 1950 | ⌀ 2013 - 2023 | +/- |
|---|---|---|---|
| Jan | 0.00 | 0.02 | 0.01 |
| Feb | 0.00 | 0.01 | 0.01 |
| Mar | 0.01 | 0.02 | 0.01 |
| Apr | 0.09 | 0.11 | 0.01 |
| May | 0.65 | 0.71 | 0.07 |
| Jun | 0.83 | 1.55 | 0.71 |
| Jul | 1.28 | 2.00 | 0.73 |
| Aug | 1.48 | 1.90 | 0.42 |
| Sep | 1.37 | 1.55 | 0.18 |
| Oct | 0.38 | 0.64 | 0.27 |
| Nov | 0.03 | 0.01 | -0.02 |
| Dec | 0.00 | 0.02 | 0.01 |
| ⌀ Month | 0.51 | 0.71 | 0.20 |
Snow (mm)
| Month | ⌀ 1940 - 1950 | ⌀ 2013 - 2023 | +/- |
|---|---|---|---|
| Jan | 0.51 | 0.64 | 0.13 |
| Feb | 0.29 | 0.60 | 0.31 |
| Mar | 0.33 | 0.44 | 0.11 |
| Apr | 0.31 | 0.42 | 0.11 |
| May | 0.10 | 0.13 | 0.03 |
| Jun | 0.00 | 0.00 | -0.00 |
| Jul | 0.00 | 0.00 | 0.00 |
| Aug | 0.01 | 0.02 | 0.01 |
| Sep | 0.17 | 0.11 | -0.06 |
| Oct | 0.51 | 0.62 | 0.11 |
| Nov | 0.67 | 0.74 | 0.07 |
| Dec | 0.51 | 0.78 | 0.27 |
| ⌀ Month | 0.28 | 0.37 | 0.09 |