Climate Chart of Victoria, Canada
Comprehensive Climate Chart of Victoria, Canada: Monthly Averages and Weather Trends
Victoria, Canada - Climate Overview
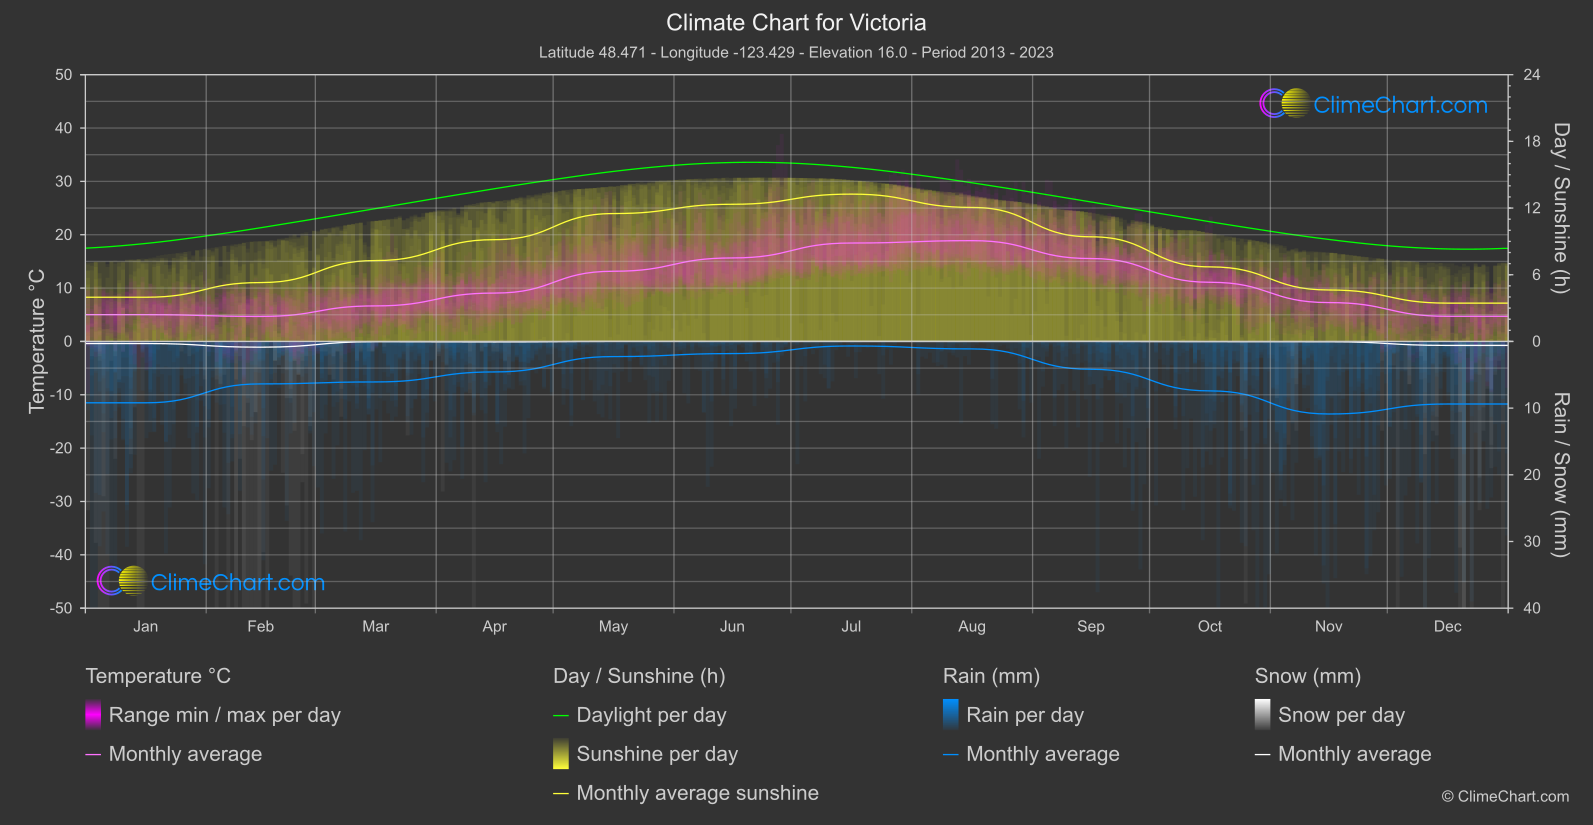
Victoria, the capital city of British Columbia, Canada, enjoys a temperate marine climate characterized by mild, rainy winters and relatively dry summers. The average annual temperature in Victoria ranges from 8°C to 18°C. The city experiences moderate rainfall throughout the year, with the wettest months typically from November to February. Fog is common during the cooler months, especially in the morning.
Best Travel Time Guide for Victoria, Canada: Ideal Seasons and Weather Insights
The best time to travel to Victoria, Canada, is during the summer months of June to August when the weather is pleasant with average temperatures ranging from 15°C to 21°C. This period offers ideal conditions for outdoor activities and sightseeing. However, visitors should be prepared for potential rainfall and fog, especially in the early mornings.
Climate Data Overview for Victoria, Canada
Explore the comprehensive climate data for Victoria, Canada. This detailed table provides valuable insights into temperature variations, precipitation levels, and seasonal changes, helping you understand the unique weather patterns of this region.
| Month | ⌀ Temperature °C | ⌀ Rain (mm) | ⌀ Snow (mm) | ⌀ Sunshine (h) |
|---|---|---|---|---|
| Jan | 5.0 | 4.60 | 0.16 | 3.98 |
| Feb | 4.7 | 3.18 | 0.43 | 5.30 |
| Mar | 6.7 | 3.04 | 0.02 | 7.28 |
| Apr | 9.1 | 2.29 | 0.04 | 9.16 |
| May | 13.2 | 1.14 | 0.00 | 11.50 |
| Jun | 15.6 | 0.91 | 0.00 | 12.34 |
| Jul | 18.4 | 0.34 | 0.00 | 13.25 |
| Aug | 18.9 | 0.56 | 0.00 | 12.06 |
| Sep | 15.5 | 2.09 | 0.00 | 9.41 |
| Oct | 11.1 | 3.71 | 0.02 | 6.71 |
| Nov | 7.3 | 5.44 | 0.02 | 4.63 |
| Dec | 4.7 | 4.69 | 0.30 | 3.45 |
| ⌀ Month | 10.8 | 2.67 | 0.08 | 8.26 |