Climate Change Chart of London, Great Britain
Comprehensive Climate Change Chart of London, Great Britain: Monthly Averages and Impact Trends
Exploring the changing climate in London, United Kingdom, reveals intriguing insights into temperature, rainfall, snowfall, and sunshine duration. Let's delve deeper into the data from the 1940s to 1950s compared to the period of 2013 to 2024.
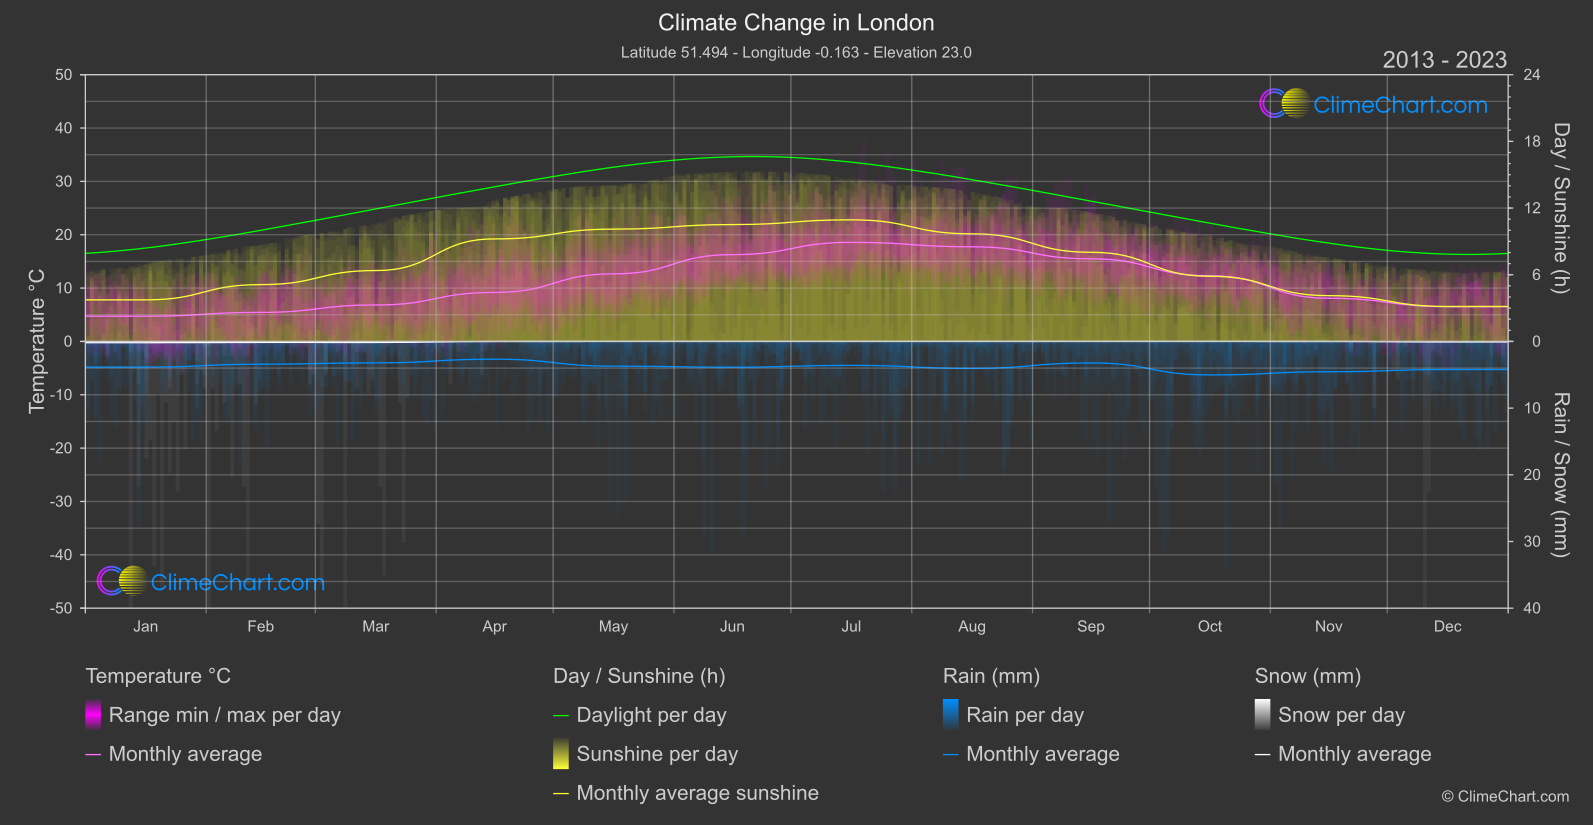
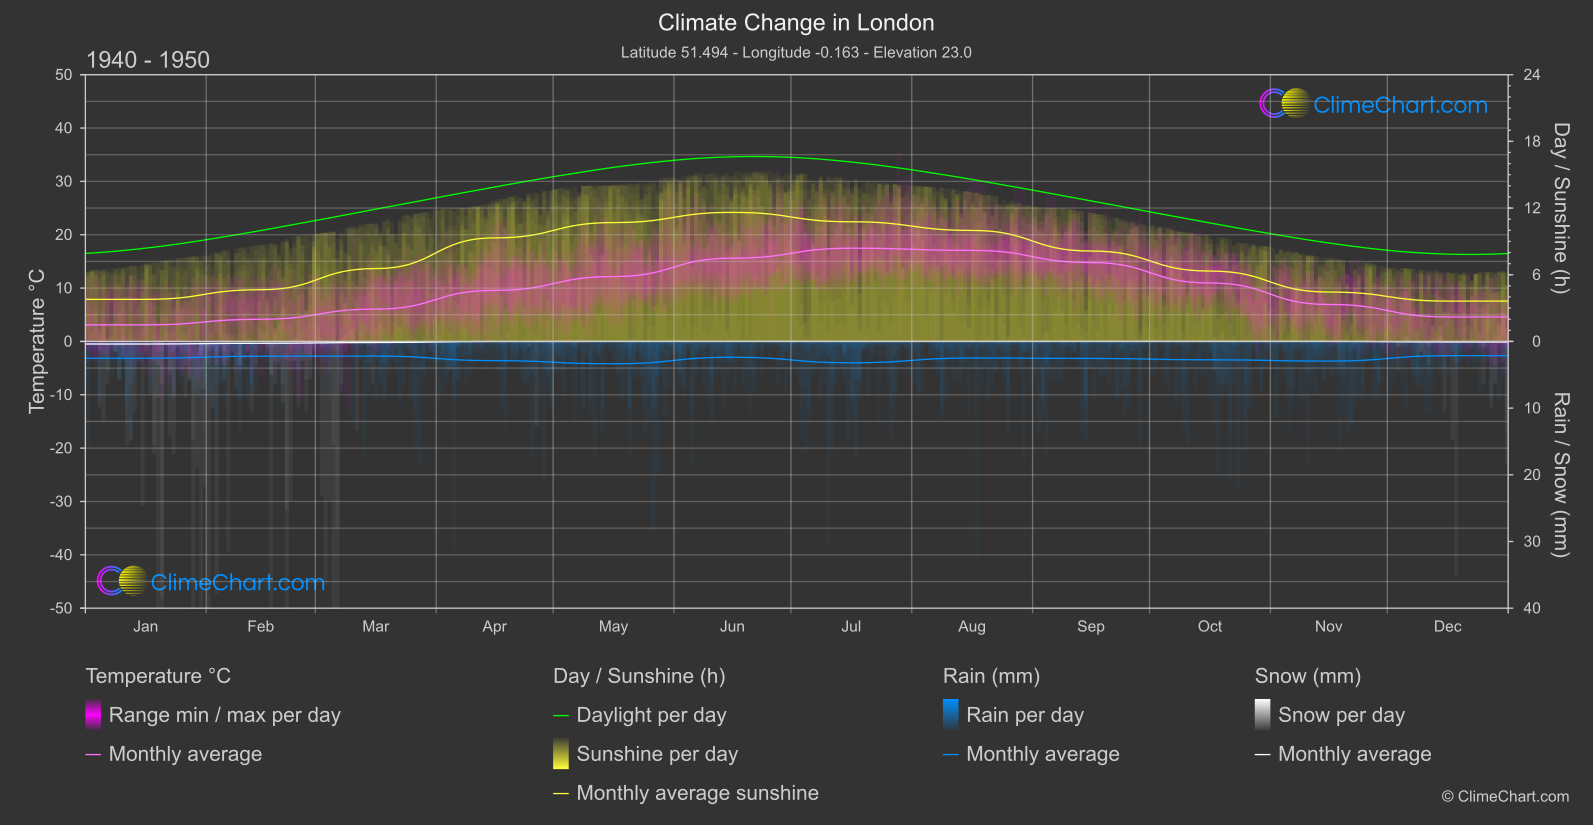
London's climate has shown noticeable changes over the years, with temperatures generally increasing across the months. The data indicates that December experienced the highest temperature change, while April saw a slight decrease. In terms of rainfall, October exhibited the most significant increase, while April had a decrease. Snowfall remained minimal throughout the years, with minor fluctuations. Sunshine duration varied, with June experiencing the most significant decrease in sunshine hours. These trends highlight the evolving climate patterns in London, impacting various aspects of daily life.
Climate Change Data Overview for London, Great Britain
Explore the comprehensive climate change data for London, Great Britain. This detailed table provides valuable insights into temperature variations, precipitation levels, and seasonal changes influenced by climate change, helping you understand the unique weather patterns of this region.
Temperature °C
| Month | ⌀ 1940 - 1950 | ⌀ 2013 - 2023 | +/- |
|---|---|---|---|
| Jan | 3.10 | 4.73 | 1.62 |
| Feb | 4.16 | 5.44 | 1.29 |
| Mar | 6.06 | 6.84 | 0.78 |
| Apr | 9.57 | 9.18 | -0.38 |
| May | 12.16 | 12.67 | 0.51 |
| Jun | 15.60 | 16.27 | 0.67 |
| Jul | 17.48 | 18.57 | 1.09 |
| Aug | 17.07 | 17.74 | 0.67 |
| Sep | 14.78 | 15.48 | 0.70 |
| Oct | 10.96 | 12.31 | 1.35 |
| Nov | 6.93 | 8.09 | 1.16 |
| Dec | 4.59 | 6.52 | 1.93 |
| ⌀ Month | 10.20 | 11.15 | 0.95 |
Sunshine (h)
| Month | ⌀ 1940 - 1950 | ⌀ 2013 - 2023 | +/- |
|---|---|---|---|
| Jan | 3.78 | 3.74 | -0.04 |
| Feb | 4.65 | 5.11 | 0.46 |
| Mar | 6.56 | 6.38 | -0.18 |
| Apr | 9.32 | 9.22 | -0.09 |
| May | 10.69 | 10.11 | -0.59 |
| Jun | 11.61 | 10.51 | -1.10 |
| Jul | 10.77 | 10.94 | 0.17 |
| Aug | 9.99 | 9.68 | -0.31 |
| Sep | 8.13 | 8.02 | -0.11 |
| Oct | 6.33 | 5.86 | -0.47 |
| Nov | 4.44 | 4.12 | -0.33 |
| Dec | 3.63 | 3.14 | -0.48 |
| ⌀ Month | 7.49 | 7.24 | -0.26 |
Rain (mm)
| Month | ⌀ 1940 - 1950 | ⌀ 2013 - 2023 | +/- |
|---|---|---|---|
| Jan | 1.26 | 1.92 | 0.66 |
| Feb | 1.11 | 1.71 | 0.60 |
| Mar | 1.10 | 1.61 | 0.51 |
| Apr | 1.44 | 1.33 | -0.11 |
| May | 1.68 | 1.85 | 0.18 |
| Jun | 1.19 | 1.93 | 0.75 |
| Jul | 1.60 | 1.79 | 0.19 |
| Aug | 1.24 | 2.02 | 0.78 |
| Sep | 1.27 | 1.61 | 0.34 |
| Oct | 1.38 | 2.51 | 1.13 |
| Nov | 1.48 | 2.27 | 0.80 |
| Dec | 1.07 | 2.10 | 1.04 |
| ⌀ Month | 1.32 | 1.89 | 0.57 |
Snow (mm)
| Month | ⌀ 1940 - 1950 | ⌀ 2013 - 2023 | +/- |
|---|---|---|---|
| Jan | 0.19 | 0.09 | -0.10 |
| Feb | 0.14 | 0.08 | -0.06 |
| Mar | 0.08 | 0.08 | -0.00 |
| Apr | 0.01 | 0.01 | -0.00 |
| May | 0.00 | 0.00 | -0.00 |
| Jun | 0.00 | 0.00 | 0.00 |
| Jul | 0.00 | 0.00 | 0.00 |
| Aug | 0.00 | 0.00 | 0.00 |
| Sep | 0.00 | 0.00 | 0.00 |
| Oct | 0.00 | 0.00 | 0.00 |
| Nov | 0.00 | 0.00 | 0.00 |
| Dec | 0.04 | 0.04 | -0.00 |
| ⌀ Month | 0.04 | 0.02 | -0.01 |