Climate Change Chart of Niagara Falls, Canada
Comprehensive Climate Change Chart of Niagara Falls, Canada: Monthly Averages and Impact Trends
Explore the changing climate in Niagara Falls, Canada, through insightful data analysis. Discover how temperatures, rainfall, snowfall, and sunshine duration have evolved over the years.
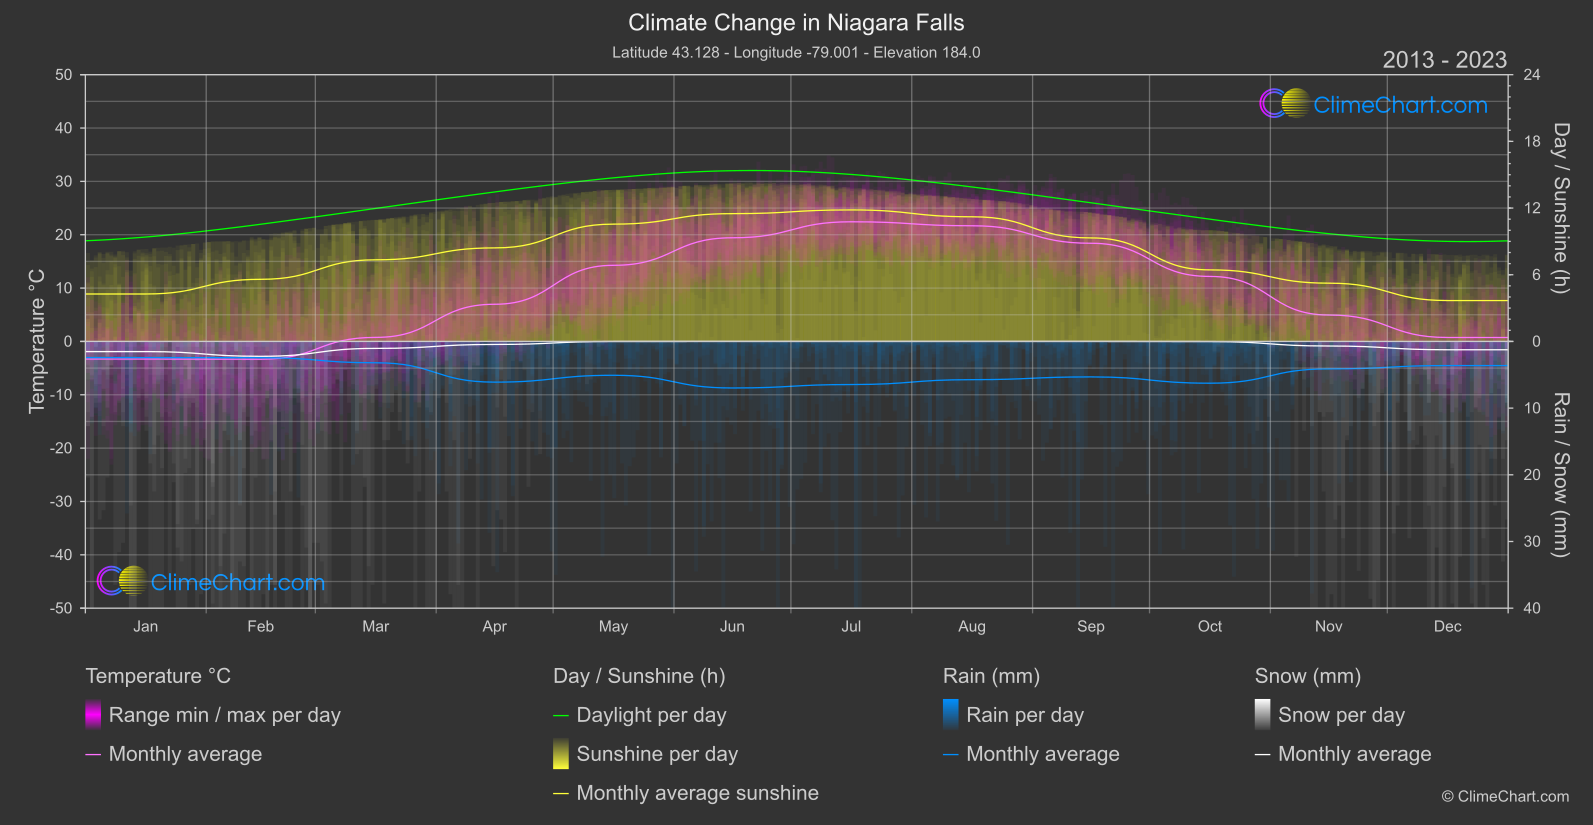
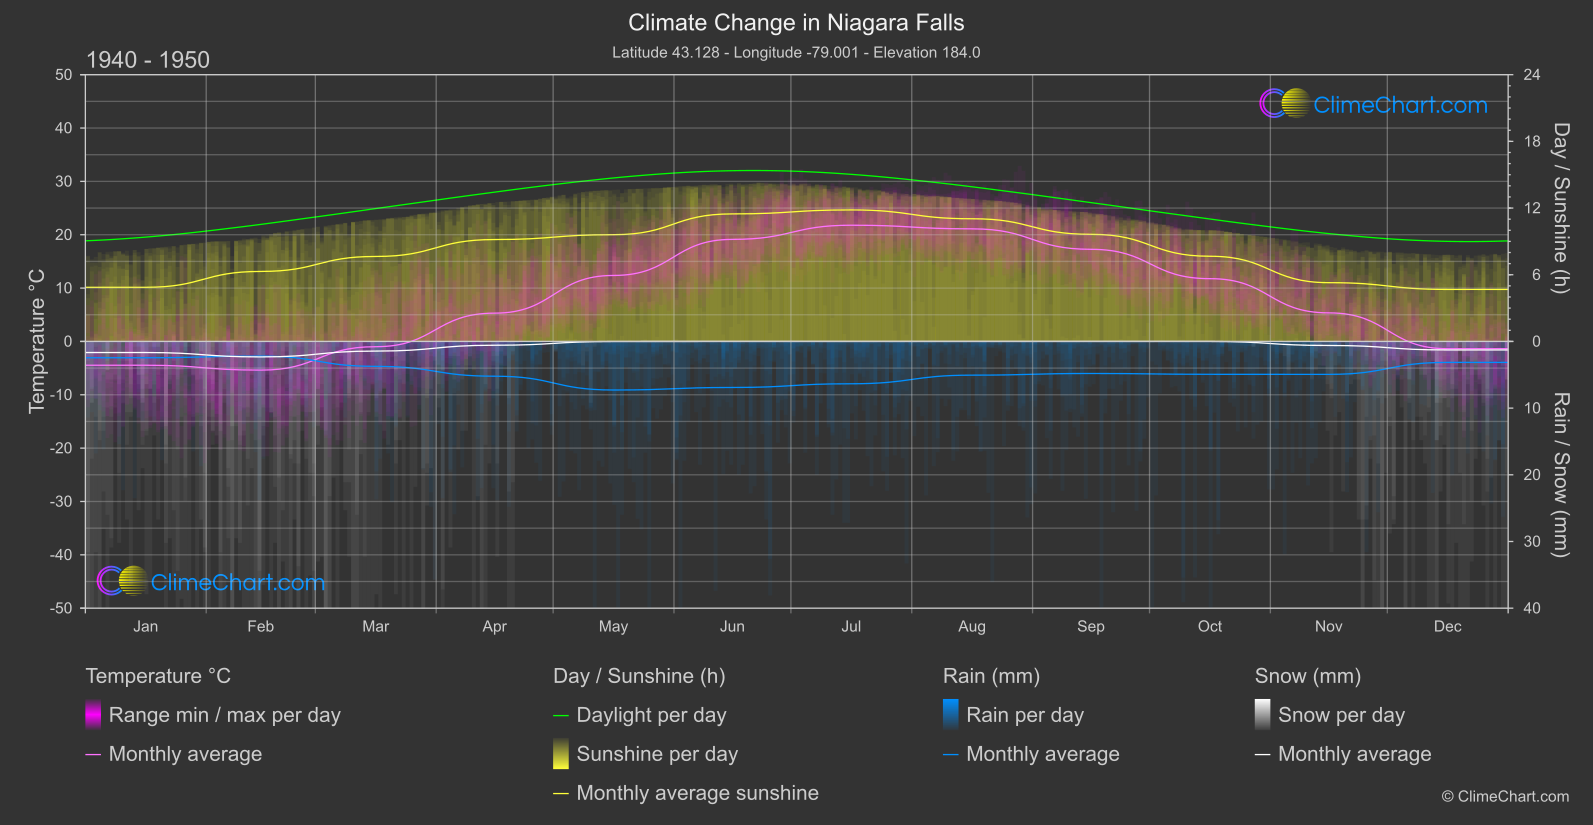
In Niagara Falls, Canada, the climate has undergone significant changes over the years. Analyzing temperature data from 1940 - 1950 compared to 2013 - 2024 reveals interesting insights. For instance, May shows a notable temperature increase of around 1.9°C, while November experiences a slight decrease of approximately 0.4°C. When it comes to rainfall, October demonstrates a substantial rise of about 0.67 mm compared to the earlier period. Snowfall, on the other hand, has varied across months with December experiencing a small decrease in snow accumulation.
Climate Change Data Overview for Niagara Falls, Canada
Explore the comprehensive climate change data for Niagara Falls, Canada. This detailed table provides valuable insights into temperature variations, precipitation levels, and seasonal changes influenced by climate change, helping you understand the unique weather patterns of this region.
Temperature °C
| Month | ⌀ 1940 - 1950 | ⌀ 2013 - 2023 | +/- |
|---|---|---|---|
| Jan | -4.46 | -3.30 | 1.17 |
| Feb | -5.38 | -3.33 | 2.04 |
| Mar | -0.99 | 0.76 | 1.75 |
| Apr | 5.30 | 6.97 | 1.66 |
| May | 12.37 | 14.27 | 1.90 |
| Jun | 19.13 | 19.43 | 0.30 |
| Jul | 21.78 | 22.43 | 0.64 |
| Aug | 21.10 | 21.68 | 0.58 |
| Sep | 17.27 | 18.40 | 1.13 |
| Oct | 11.77 | 12.18 | 0.42 |
| Nov | 5.35 | 4.95 | -0.40 |
| Dec | -1.37 | 0.74 | 2.11 |
| ⌀ Month | 8.49 | 9.60 | 1.11 |
Sunshine (h)
| Month | ⌀ 1940 - 1950 | ⌀ 2013 - 2023 | +/- |
|---|---|---|---|
| Jan | 4.87 | 4.27 | -0.60 |
| Feb | 6.30 | 5.59 | -0.71 |
| Mar | 7.64 | 7.34 | -0.30 |
| Apr | 9.17 | 8.42 | -0.75 |
| May | 9.61 | 10.55 | 0.95 |
| Jun | 11.47 | 11.50 | 0.02 |
| Jul | 11.83 | 11.83 | 0.00 |
| Aug | 11.04 | 11.21 | 0.18 |
| Sep | 9.64 | 9.31 | -0.32 |
| Oct | 7.66 | 6.44 | -1.23 |
| Nov | 5.29 | 5.24 | -0.05 |
| Dec | 4.68 | 3.68 | -1.00 |
| ⌀ Month | 8.27 | 7.95 | -0.32 |
Rain (mm)
| Month | ⌀ 1940 - 1950 | ⌀ 2013 - 2023 | +/- |
|---|---|---|---|
| Jan | 1.22 | 1.21 | -0.01 |
| Feb | 1.10 | 1.22 | 0.12 |
| Mar | 1.87 | 1.60 | -0.27 |
| Apr | 2.61 | 3.05 | 0.44 |
| May | 3.64 | 2.54 | -1.10 |
| Jun | 3.45 | 3.49 | 0.04 |
| Jul | 3.17 | 3.23 | 0.06 |
| Aug | 2.53 | 2.87 | 0.34 |
| Sep | 2.40 | 2.66 | 0.26 |
| Oct | 2.47 | 3.13 | 0.67 |
| Nov | 2.47 | 2.06 | -0.41 |
| Dec | 1.57 | 1.81 | 0.24 |
| ⌀ Month | 2.38 | 2.41 | 0.03 |
Snow (mm)
| Month | ⌀ 1940 - 1950 | ⌀ 2013 - 2023 | +/- |
|---|---|---|---|
| Jan | 0.83 | 0.76 | -0.07 |
| Feb | 1.16 | 1.12 | -0.05 |
| Mar | 0.72 | 0.52 | -0.20 |
| Apr | 0.29 | 0.23 | -0.06 |
| May | 0.00 | 0.00 | -0.00 |
| Jun | 0.00 | 0.00 | 0.00 |
| Jul | 0.00 | 0.00 | 0.00 |
| Aug | 0.00 | 0.00 | 0.00 |
| Sep | 0.00 | 0.00 | 0.00 |
| Oct | 0.00 | 0.01 | 0.01 |
| Nov | 0.30 | 0.34 | 0.04 |
| Dec | 0.64 | 0.62 | -0.01 |
| ⌀ Month | 0.33 | 0.30 | -0.03 |