Climate Change Chart of Regina, Canada
Comprehensive Climate Change Chart of Regina, Canada: Monthly Averages and Impact Trends
Exploring the changing climate in Regina, Canada reveals intriguing insights into temperature, rainfall, snowfall, and sunshine duration over the years.
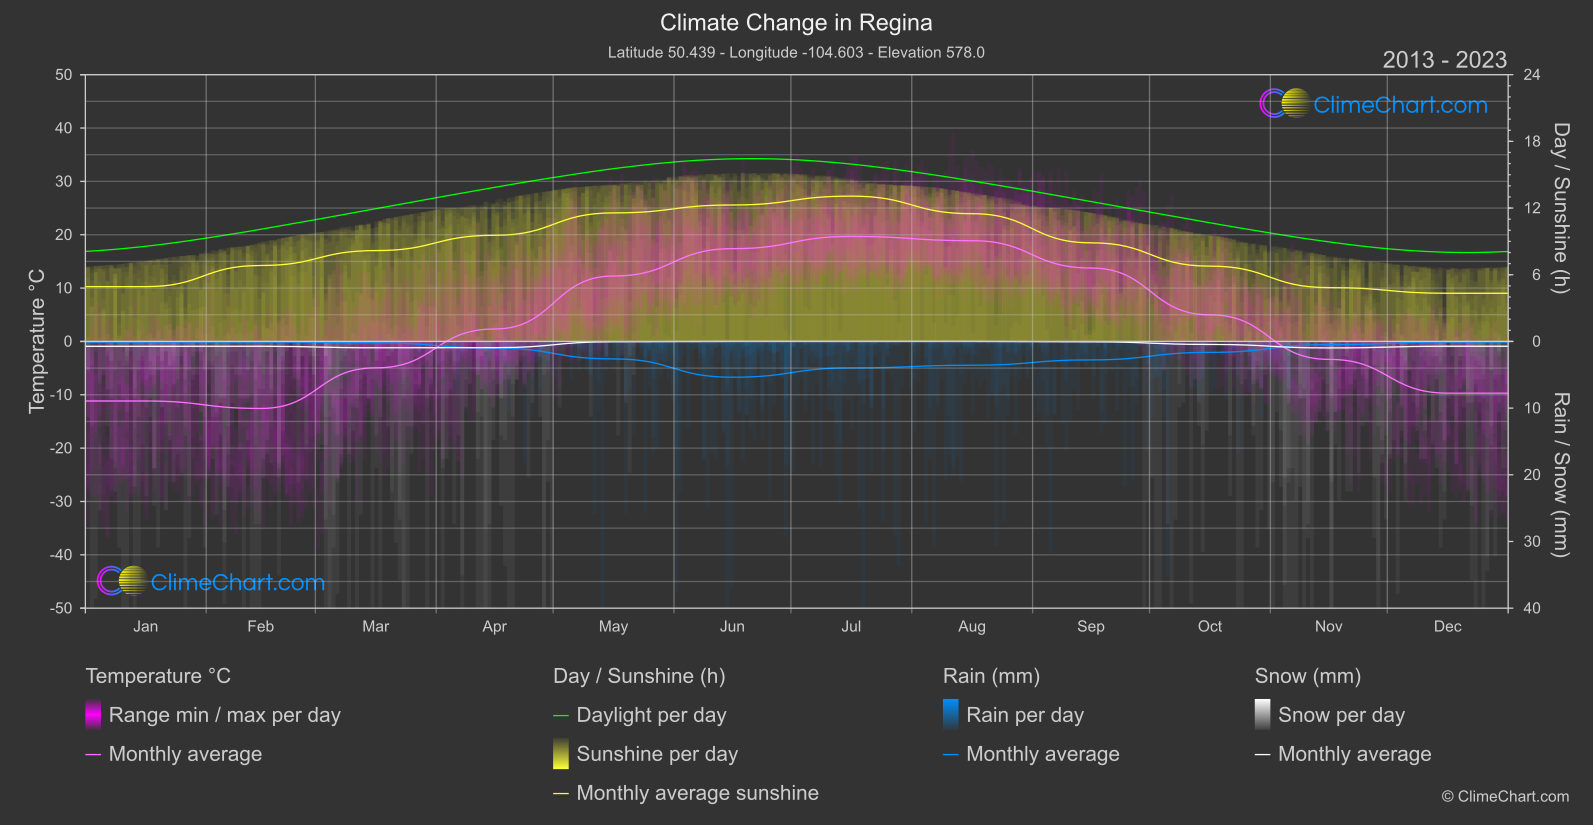
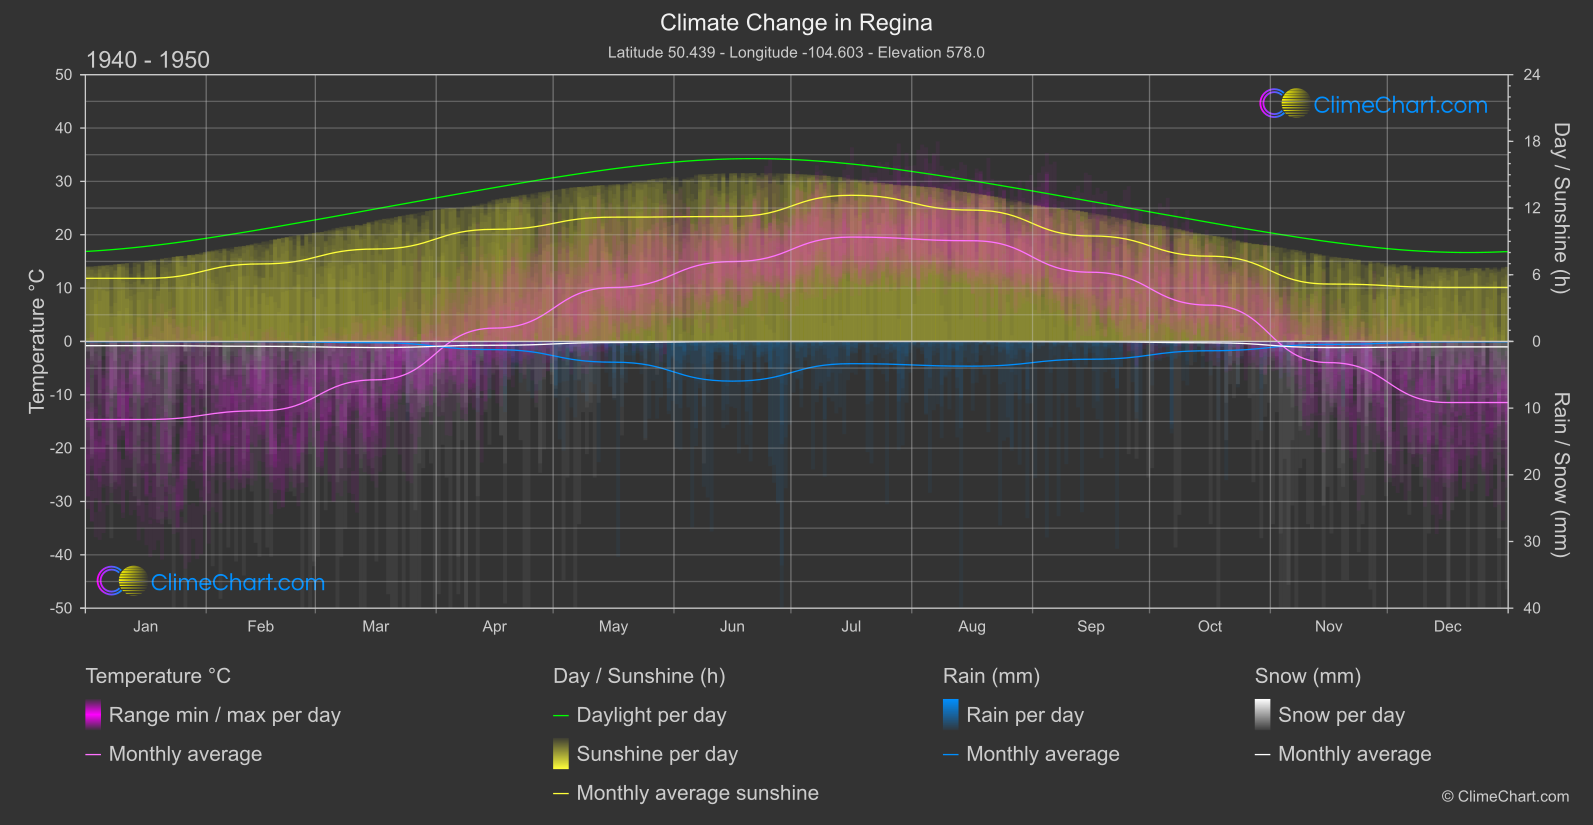
Regina, Canada experiences varying temperature changes with the highest increase noted in June, while October sees a significant decrease. Rainfall patterns also shift, with May experiencing a notable decrease in precipitation. Snowfall shows an increase in October compared to the past. Sunshine duration in Regina fluctuates, with June showing the highest increase in hours of sunshine. These insights shed light on the evolving climate trends in the region.
Climate Change Data Overview for Regina, Canada
Explore the comprehensive climate change data for Regina, Canada. This detailed table provides valuable insights into temperature variations, precipitation levels, and seasonal changes influenced by climate change, helping you understand the unique weather patterns of this region.
Temperature °C
| Month | ⌀ 1940 - 1950 | ⌀ 2013 - 2023 | +/- |
|---|---|---|---|
| Jan | -14.63 | -11.16 | 3.47 |
| Feb | -12.99 | -12.56 | 0.43 |
| Mar | -7.20 | -4.95 | 2.24 |
| Apr | 2.50 | 2.33 | -0.17 |
| May | 10.11 | 12.26 | 2.15 |
| Jun | 14.97 | 17.39 | 2.42 |
| Jul | 19.56 | 19.68 | 0.12 |
| Aug | 18.88 | 18.88 | 0.00 |
| Sep | 12.97 | 13.76 | 0.79 |
| Oct | 6.80 | 4.98 | -1.82 |
| Nov | -3.97 | -3.36 | 0.61 |
| Dec | -11.45 | -9.70 | 1.76 |
| ⌀ Month | 2.96 | 3.96 | 1.00 |
Sunshine (h)
| Month | ⌀ 1940 - 1950 | ⌀ 2013 - 2023 | +/- |
|---|---|---|---|
| Jan | 5.68 | 4.93 | -0.75 |
| Feb | 6.97 | 6.83 | -0.14 |
| Mar | 8.31 | 8.17 | -0.14 |
| Apr | 10.09 | 9.55 | -0.54 |
| May | 11.18 | 11.57 | 0.38 |
| Jun | 11.24 | 12.28 | 1.04 |
| Jul | 13.15 | 13.07 | -0.07 |
| Aug | 11.82 | 11.49 | -0.33 |
| Sep | 9.49 | 8.87 | -0.62 |
| Oct | 7.67 | 6.77 | -0.89 |
| Nov | 5.16 | 4.84 | -0.32 |
| Dec | 4.86 | 4.33 | -0.53 |
| ⌀ Month | 8.80 | 8.56 | -0.24 |
Rain (mm)
| Month | ⌀ 1940 - 1950 | ⌀ 2013 - 2023 | +/- |
|---|---|---|---|
| Jan | 0.01 | 0.05 | 0.04 |
| Feb | 0.01 | 0.05 | 0.04 |
| Mar | 0.10 | 0.10 | 0.00 |
| Apr | 0.61 | 0.50 | -0.11 |
| May | 1.56 | 1.31 | -0.25 |
| Jun | 2.98 | 2.68 | -0.29 |
| Jul | 1.67 | 1.99 | 0.32 |
| Aug | 1.85 | 1.78 | -0.07 |
| Sep | 1.33 | 1.38 | 0.05 |
| Oct | 0.70 | 0.82 | 0.12 |
| Nov | 0.22 | 0.24 | 0.02 |
| Dec | 0.03 | 0.05 | 0.02 |
| ⌀ Month | 0.92 | 0.91 | -0.01 |
Snow (mm)
| Month | ⌀ 1940 - 1950 | ⌀ 2013 - 2023 | +/- |
|---|---|---|---|
| Jan | 0.32 | 0.37 | 0.05 |
| Feb | 0.36 | 0.36 | -0.00 |
| Mar | 0.46 | 0.48 | 0.02 |
| Apr | 0.29 | 0.47 | 0.18 |
| May | 0.08 | 0.02 | -0.06 |
| Jun | 0.01 | 0.00 | -0.01 |
| Jul | 0.00 | 0.00 | 0.00 |
| Aug | 0.00 | 0.00 | 0.00 |
| Sep | 0.02 | 0.03 | 0.01 |
| Oct | 0.10 | 0.22 | 0.12 |
| Nov | 0.46 | 0.49 | 0.03 |
| Dec | 0.41 | 0.36 | -0.05 |
| ⌀ Month | 0.21 | 0.23 | 0.02 |