Climate Change Chart of Saint John, Canada
Comprehensive Climate Change Chart of Saint John, Canada: Monthly Averages and Impact Trends
Explore the changing climate in Saint John, Canada, with insights into temperature, rainfall, snowfall, and sunshine duration over the years.
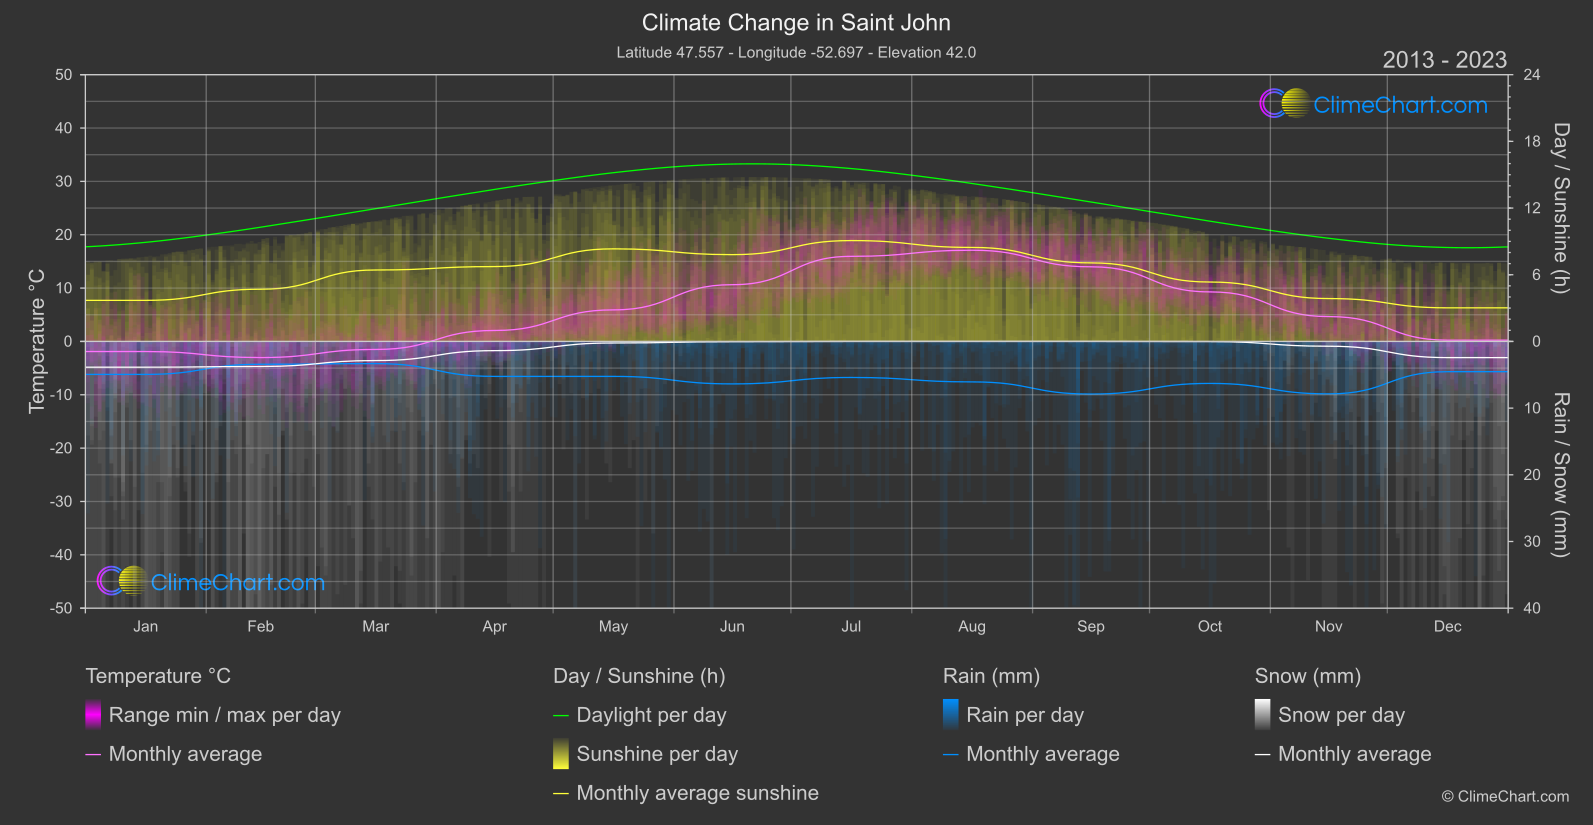
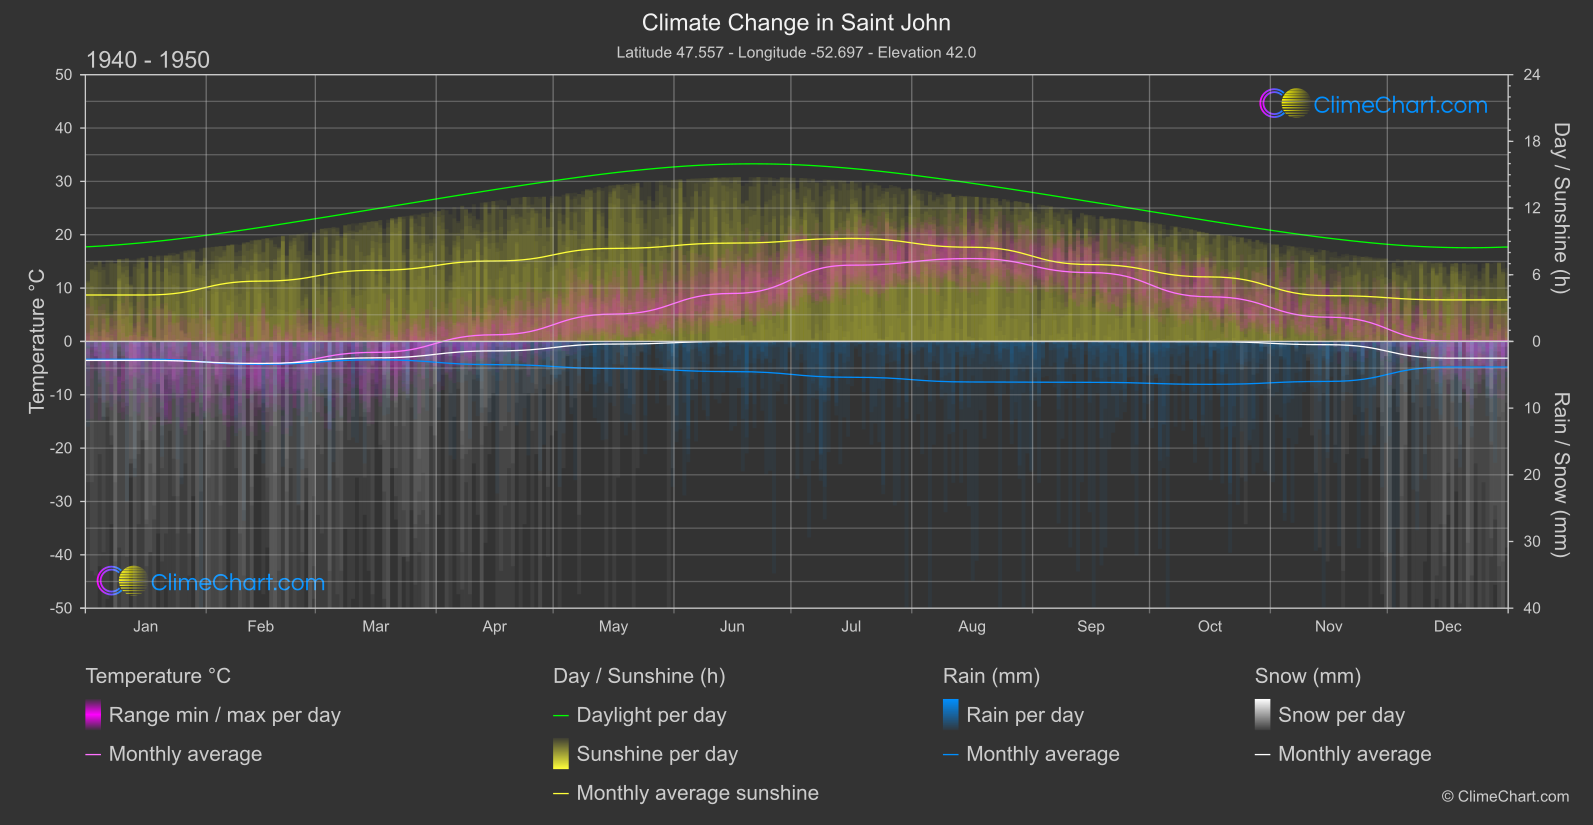
Saint John, Canada, has experienced significant changes in temperature, rainfall, snowfall, and sunshine duration over the years. From the data provided, it is evident that the month of July has seen the highest increase in temperature, while September has experienced the most significant rise in rainfall. Additionally, snowfall has decreased in several months like May and December, with a notable increase in sunshine duration during March and a decrease in June. These insights highlight the ongoing impact of climate change on the weather patterns in Saint John.
Climate Change Data Overview for Saint John, Canada
Explore the comprehensive climate change data for Saint John, Canada. This detailed table provides valuable insights into temperature variations, precipitation levels, and seasonal changes influenced by climate change, helping you understand the unique weather patterns of this region.
Temperature °C
| Month | ⌀ 1940 - 1950 | ⌀ 2013 - 2023 | +/- |
|---|---|---|---|
| Jan | -3.46 | -1.90 | 1.57 |
| Feb | -4.25 | -3.02 | 1.23 |
| Mar | -2.05 | -1.50 | 0.54 |
| Apr | 1.24 | 2.05 | 0.81 |
| May | 5.12 | 5.91 | 0.80 |
| Jun | 8.99 | 10.64 | 1.64 |
| Jul | 14.29 | 15.95 | 1.65 |
| Aug | 15.54 | 17.10 | 1.56 |
| Sep | 12.90 | 13.99 | 1.09 |
| Oct | 8.37 | 9.28 | 0.92 |
| Nov | 4.54 | 4.66 | 0.11 |
| Dec | 0.05 | 0.24 | 0.19 |
| ⌀ Month | 5.11 | 6.12 | 1.01 |
Sunshine (h)
| Month | ⌀ 1940 - 1950 | ⌀ 2013 - 2023 | +/- |
|---|---|---|---|
| Jan | 4.18 | 3.70 | -0.48 |
| Feb | 5.43 | 4.70 | -0.73 |
| Mar | 6.41 | 6.43 | 0.02 |
| Apr | 7.24 | 6.74 | -0.50 |
| May | 8.37 | 8.33 | -0.04 |
| Jun | 8.85 | 7.81 | -1.04 |
| Jul | 9.26 | 9.07 | -0.19 |
| Aug | 8.47 | 8.46 | -0.02 |
| Sep | 6.92 | 7.07 | 0.15 |
| Oct | 5.80 | 5.34 | -0.46 |
| Nov | 4.12 | 3.86 | -0.26 |
| Dec | 3.74 | 3.02 | -0.71 |
| ⌀ Month | 6.56 | 6.21 | -0.35 |
Rain (mm)
| Month | ⌀ 1940 - 1950 | ⌀ 2013 - 2023 | +/- |
|---|---|---|---|
| Jan | 1.33 | 2.47 | 1.14 |
| Feb | 1.71 | 1.71 | -0.00 |
| Mar | 1.38 | 1.66 | 0.28 |
| Apr | 1.74 | 2.62 | 0.88 |
| May | 2.03 | 2.62 | 0.59 |
| Jun | 2.26 | 3.18 | 0.92 |
| Jul | 2.69 | 2.70 | 0.01 |
| Aug | 3.04 | 3.03 | -0.01 |
| Sep | 3.07 | 3.95 | 0.88 |
| Oct | 3.22 | 3.15 | -0.07 |
| Nov | 3.00 | 3.93 | 0.94 |
| Dec | 1.92 | 2.27 | 0.35 |
| ⌀ Month | 2.28 | 2.78 | 0.49 |
Snow (mm)
| Month | ⌀ 1940 - 1950 | ⌀ 2013 - 2023 | +/- |
|---|---|---|---|
| Jan | 1.42 | 1.93 | 0.51 |
| Feb | 1.65 | 1.88 | 0.23 |
| Mar | 1.23 | 1.43 | 0.21 |
| Apr | 0.71 | 0.69 | -0.02 |
| May | 0.20 | 0.12 | -0.08 |
| Jun | 0.00 | 0.02 | 0.02 |
| Jul | 0.00 | 0.00 | 0.00 |
| Aug | 0.00 | 0.00 | 0.00 |
| Sep | 0.00 | 0.00 | 0.00 |
| Oct | 0.02 | 0.01 | -0.01 |
| Nov | 0.24 | 0.36 | 0.11 |
| Dec | 1.26 | 1.21 | -0.04 |
| ⌀ Month | 0.56 | 0.64 | 0.08 |