Climate Change Chart of Fredericton, Canada
Comprehensive Climate Change Chart of Fredericton, Canada: Monthly Averages and Impact Trends
Explore the changing climate in Fredericton, Canada through insightful data analysis.
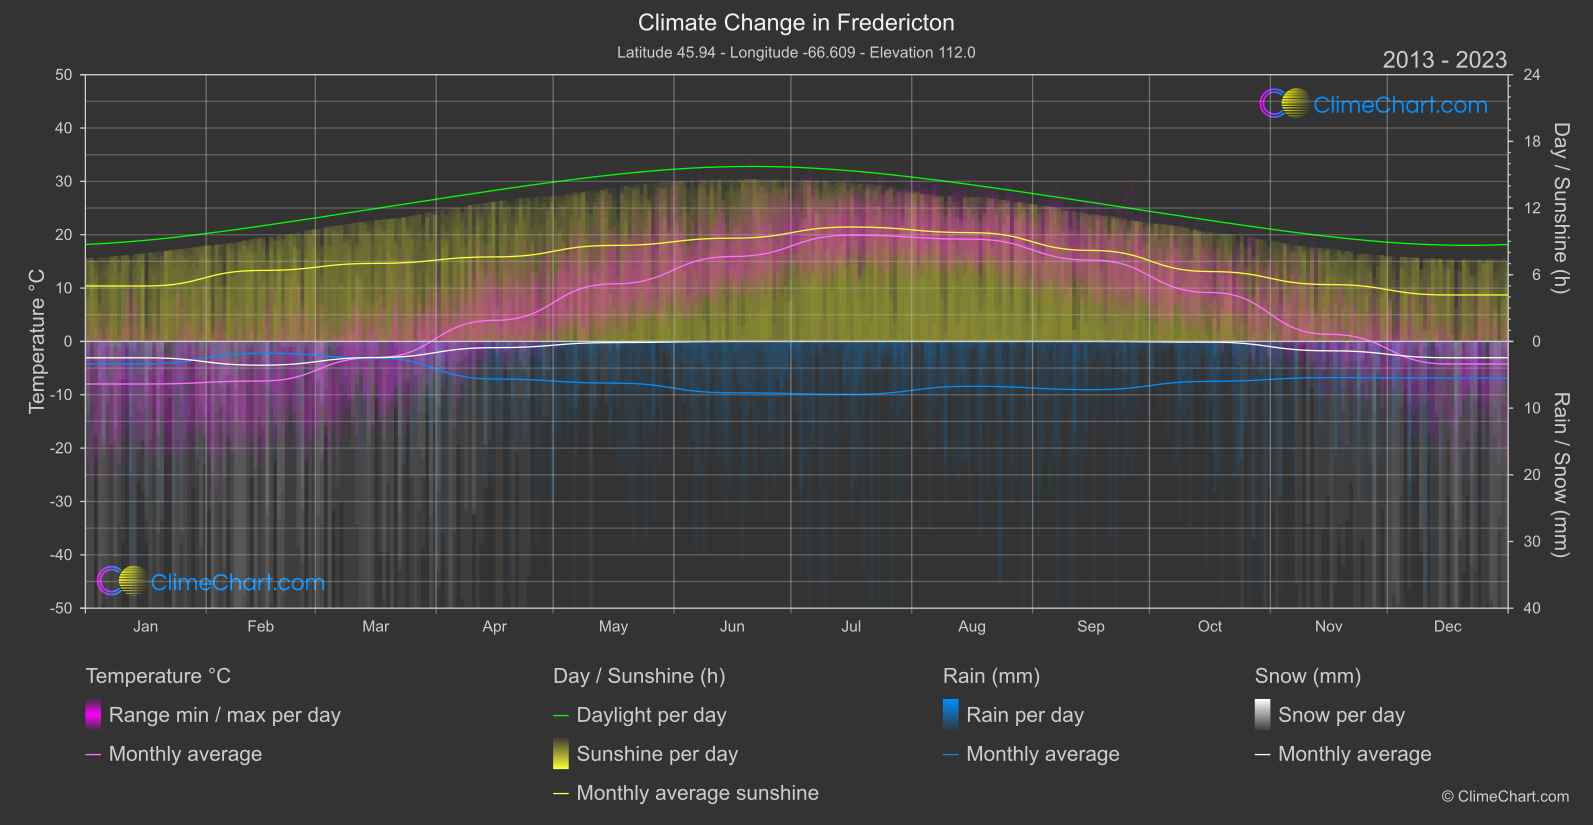
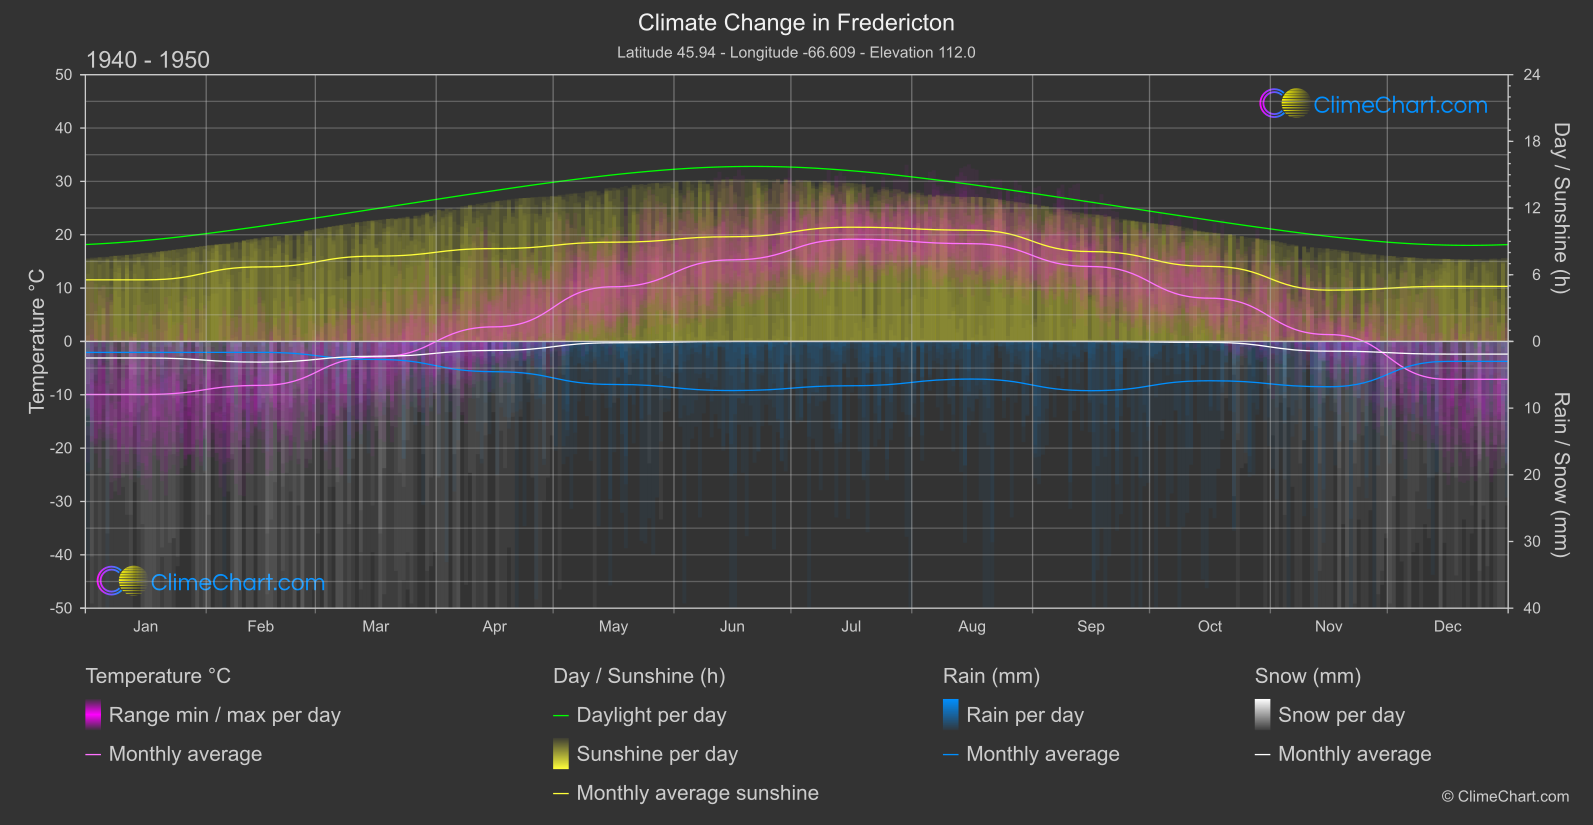
Fredericton, Canada experiences notable changes in temperature, rainfall, snowfall, and sunshine duration. Comparing data from 1940-1950 to 2013-2024 reveals interesting trends. For instance, December shows the highest temperature change of 2.87°C, while May has the highest rainfall change of 1.25mm. Snowfall has decreased over the years, with April having a significant change of -0.21mm. Additionally, sunshine duration has fluctuated, with June experiencing a decrease of 0.13 hours.
Climate Change Data Overview for Fredericton, Canada
Explore the comprehensive climate change data for Fredericton, Canada. This detailed table provides valuable insights into temperature variations, precipitation levels, and seasonal changes influenced by climate change, helping you understand the unique weather patterns of this region.
Temperature °C
| Month | ⌀ 1940 - 1950 | ⌀ 2013 - 2023 | +/- |
|---|---|---|---|
| Jan | -9.94 | -7.98 | 1.96 |
| Feb | -8.24 | -7.42 | 0.82 |
| Mar | -2.90 | -3.02 | -0.12 |
| Apr | 2.74 | 3.95 | 1.22 |
| May | 10.25 | 10.79 | 0.54 |
| Jun | 15.28 | 15.92 | 0.63 |
| Jul | 19.16 | 19.93 | 0.76 |
| Aug | 18.32 | 19.17 | 0.84 |
| Sep | 14.04 | 15.24 | 1.20 |
| Oct | 8.11 | 9.18 | 1.07 |
| Nov | 1.28 | 1.33 | 0.05 |
| Dec | -7.10 | -4.23 | 2.87 |
| ⌀ Month | 5.08 | 6.07 | 0.99 |
Sunshine (h)
| Month | ⌀ 1940 - 1950 | ⌀ 2013 - 2023 | +/- |
|---|---|---|---|
| Jan | 5.54 | 4.99 | -0.56 |
| Feb | 6.70 | 6.39 | -0.32 |
| Mar | 7.68 | 7.02 | -0.65 |
| Apr | 8.35 | 7.60 | -0.75 |
| May | 8.93 | 8.64 | -0.29 |
| Jun | 9.42 | 9.29 | -0.13 |
| Jul | 10.28 | 10.29 | 0.02 |
| Aug | 10.01 | 9.79 | -0.22 |
| Sep | 8.08 | 8.19 | 0.10 |
| Oct | 6.75 | 6.29 | -0.47 |
| Nov | 4.61 | 5.12 | 0.50 |
| Dec | 4.95 | 4.18 | -0.77 |
| ⌀ Month | 7.61 | 7.32 | -0.29 |
Rain (mm)
| Month | ⌀ 1940 - 1950 | ⌀ 2013 - 2023 | +/- |
|---|---|---|---|
| Jan | 0.82 | 1.68 | 0.86 |
| Feb | 0.82 | 0.88 | 0.06 |
| Mar | 1.35 | 1.24 | -0.11 |
| Apr | 2.27 | 2.82 | 0.55 |
| May | 3.23 | 3.12 | -0.10 |
| Jun | 3.68 | 3.85 | 0.17 |
| Jul | 3.32 | 3.97 | 0.65 |
| Aug | 2.82 | 3.36 | 0.54 |
| Sep | 3.69 | 3.62 | -0.08 |
| Oct | 2.95 | 2.99 | 0.04 |
| Nov | 3.40 | 2.71 | -0.69 |
| Dec | 1.50 | 2.75 | 1.25 |
| ⌀ Month | 2.49 | 2.75 | 0.26 |
Snow (mm)
| Month | ⌀ 1940 - 1950 | ⌀ 2013 - 2023 | +/- |
|---|---|---|---|
| Jan | 1.24 | 1.23 | -0.01 |
| Feb | 1.55 | 1.78 | 0.23 |
| Mar | 1.11 | 1.21 | 0.10 |
| Apr | 0.67 | 0.47 | -0.21 |
| May | 0.10 | 0.09 | -0.02 |
| Jun | 0.00 | 0.00 | -0.00 |
| Jul | 0.00 | 0.00 | 0.00 |
| Aug | 0.00 | 0.00 | 0.00 |
| Sep | 0.00 | 0.00 | 0.00 |
| Oct | 0.07 | 0.05 | -0.02 |
| Nov | 0.73 | 0.70 | -0.03 |
| Dec | 0.95 | 1.22 | 0.27 |
| ⌀ Month | 0.54 | 0.56 | 0.03 |