Climate Change Chart of Mississauga, Canada
Comprehensive Climate Change Chart of Mississauga, Canada: Monthly Averages and Impact Trends
Explore the changing climate in Mississauga, Canada with insightful data analysis.
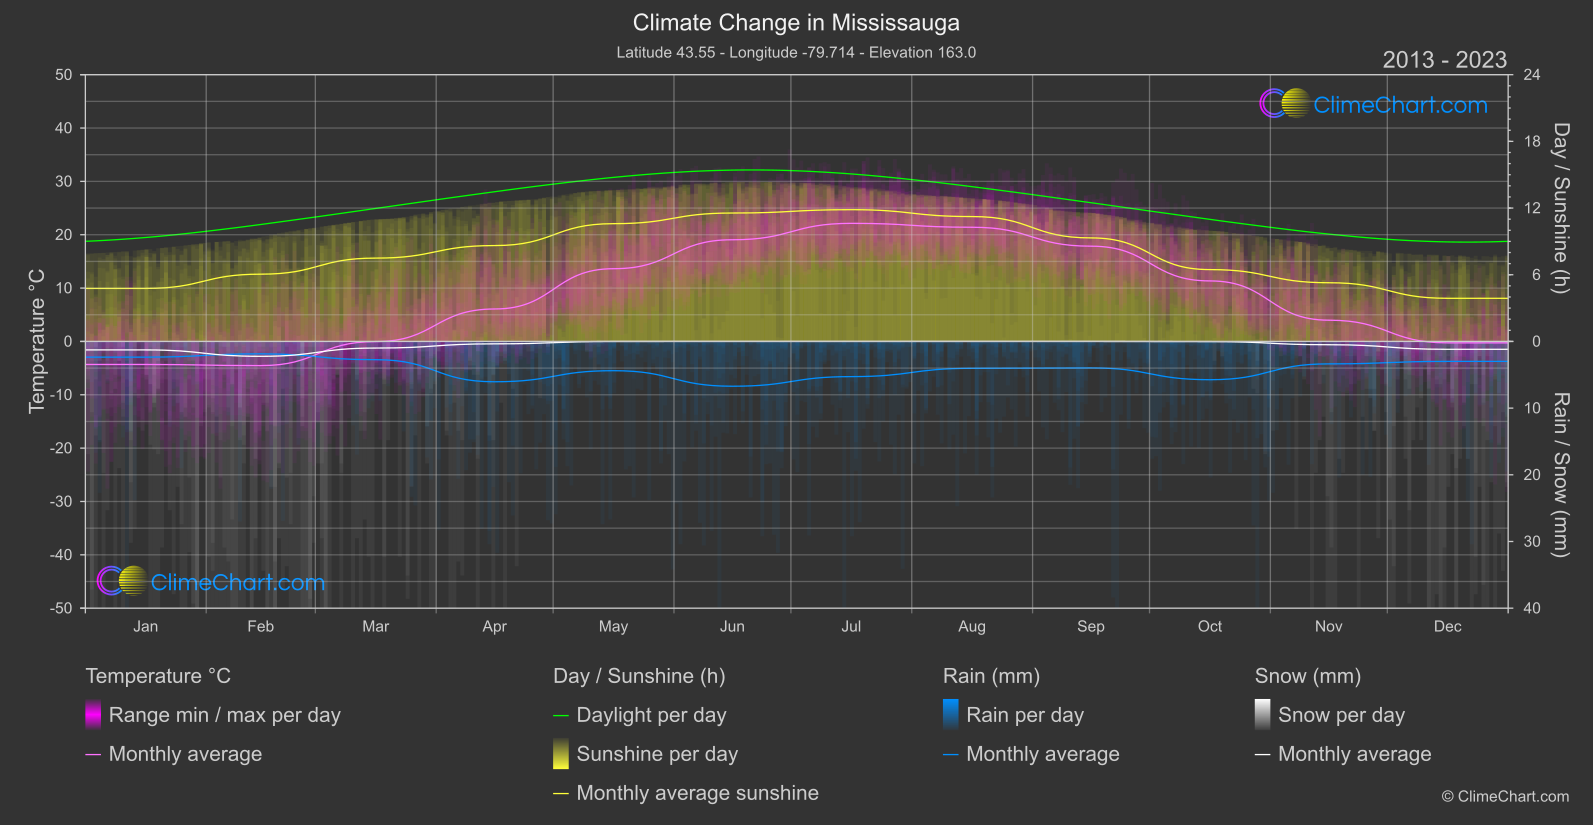
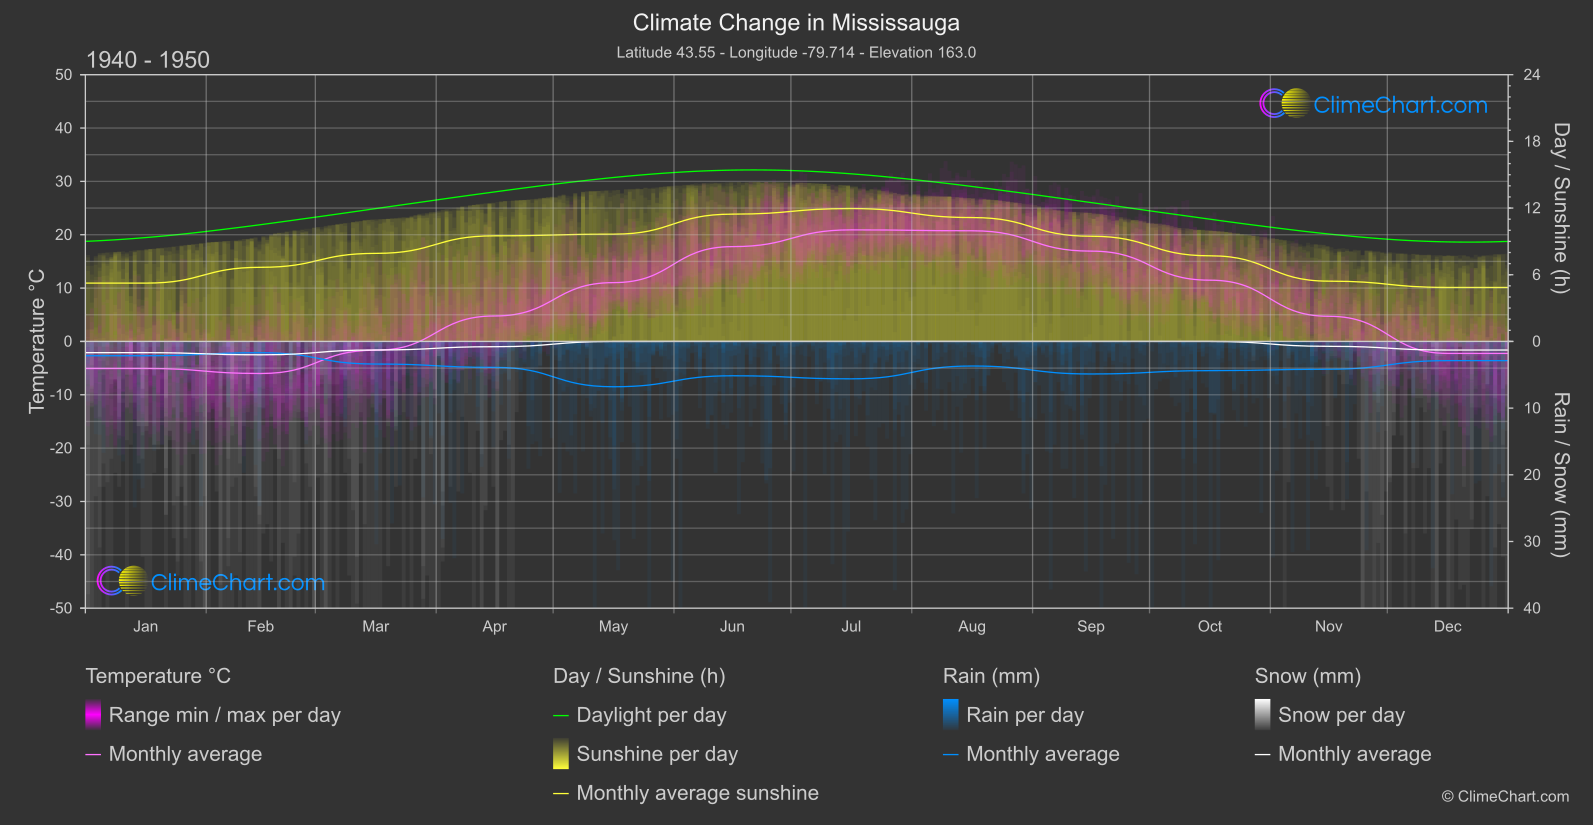
Mississauga, Canada, has experienced significant climate changes over the years. From temperature fluctuations to changes in rainfall and snowfall, the data paints a clear picture of the evolving weather patterns. One interesting insight from the data is that the month of May has shown a noticeable increase in temperature compared to the historical period. Additionally, the data reveals fluctuations in rainfall levels, with April experiencing a considerable rise in rainfall amounts.
Climate Change Data Overview for Mississauga, Canada
Explore the comprehensive climate change data for Mississauga, Canada. This detailed table provides valuable insights into temperature variations, precipitation levels, and seasonal changes influenced by climate change, helping you understand the unique weather patterns of this region.
Temperature °C
| Month | ⌀ 1940 - 1950 | ⌀ 2013 - 2023 | +/- |
|---|---|---|---|
| Jan | -5.07 | -4.32 | 0.75 |
| Feb | -6.01 | -4.53 | 1.48 |
| Mar | -1.64 | -0.03 | 1.61 |
| Apr | 4.77 | 6.08 | 1.31 |
| May | 11.02 | 13.63 | 2.61 |
| Jun | 17.77 | 19.06 | 1.29 |
| Jul | 20.91 | 22.13 | 1.22 |
| Aug | 20.74 | 21.40 | 0.66 |
| Sep | 16.93 | 17.86 | 0.93 |
| Oct | 11.48 | 11.34 | -0.14 |
| Nov | 4.71 | 3.98 | -0.73 |
| Dec | -2.25 | -0.27 | 1.98 |
| ⌀ Month | 7.78 | 8.86 | 1.08 |
Sunshine (h)
| Month | ⌀ 1940 - 1950 | ⌀ 2013 - 2023 | +/- |
|---|---|---|---|
| Jan | 5.25 | 4.77 | -0.48 |
| Feb | 6.67 | 6.05 | -0.62 |
| Mar | 7.92 | 7.50 | -0.43 |
| Apr | 9.50 | 8.63 | -0.88 |
| May | 9.65 | 10.60 | 0.94 |
| Jun | 11.45 | 11.55 | 0.10 |
| Jul | 11.96 | 11.85 | -0.10 |
| Aug | 11.15 | 11.24 | 0.09 |
| Sep | 9.46 | 9.31 | -0.15 |
| Oct | 7.70 | 6.46 | -1.24 |
| Nov | 5.42 | 5.28 | -0.14 |
| Dec | 4.86 | 3.88 | -0.98 |
| ⌀ Month | 8.42 | 8.09 | -0.32 |
Rain (mm)
| Month | ⌀ 1940 - 1950 | ⌀ 2013 - 2023 | +/- |
|---|---|---|---|
| Jan | 1.07 | 1.18 | 0.10 |
| Feb | 0.85 | 0.93 | 0.08 |
| Mar | 1.69 | 1.37 | -0.33 |
| Apr | 1.94 | 3.02 | 1.08 |
| May | 3.40 | 2.19 | -1.20 |
| Jun | 2.57 | 3.36 | 0.78 |
| Jul | 2.80 | 2.64 | -0.17 |
| Aug | 1.84 | 2.01 | 0.17 |
| Sep | 2.44 | 1.99 | -0.45 |
| Oct | 2.19 | 2.87 | 0.68 |
| Nov | 2.08 | 1.68 | -0.40 |
| Dec | 1.44 | 1.50 | 0.06 |
| ⌀ Month | 2.03 | 2.06 | 0.03 |
Snow (mm)
| Month | ⌀ 1940 - 1950 | ⌀ 2013 - 2023 | +/- |
|---|---|---|---|
| Jan | 0.84 | 0.64 | -0.21 |
| Feb | 1.00 | 1.12 | 0.11 |
| Mar | 0.64 | 0.50 | -0.14 |
| Apr | 0.40 | 0.18 | -0.22 |
| May | 0.00 | 0.00 | 0.00 |
| Jun | 0.00 | 0.00 | 0.00 |
| Jul | 0.00 | 0.00 | 0.00 |
| Aug | 0.00 | 0.00 | 0.00 |
| Sep | 0.00 | 0.00 | 0.00 |
| Oct | 0.00 | 0.01 | 0.01 |
| Nov | 0.37 | 0.25 | -0.12 |
| Dec | 0.64 | 0.59 | -0.05 |
| ⌀ Month | 0.32 | 0.27 | -0.05 |