Climate Change Chart of Surrey, Canada
Comprehensive Climate Change Chart of Surrey, Canada: Monthly Averages and Impact Trends
Exploring the climate changes in Surrey, Canada reveals intriguing insights into temperature, rainfall, snowfall, and sunshine duration over the years.
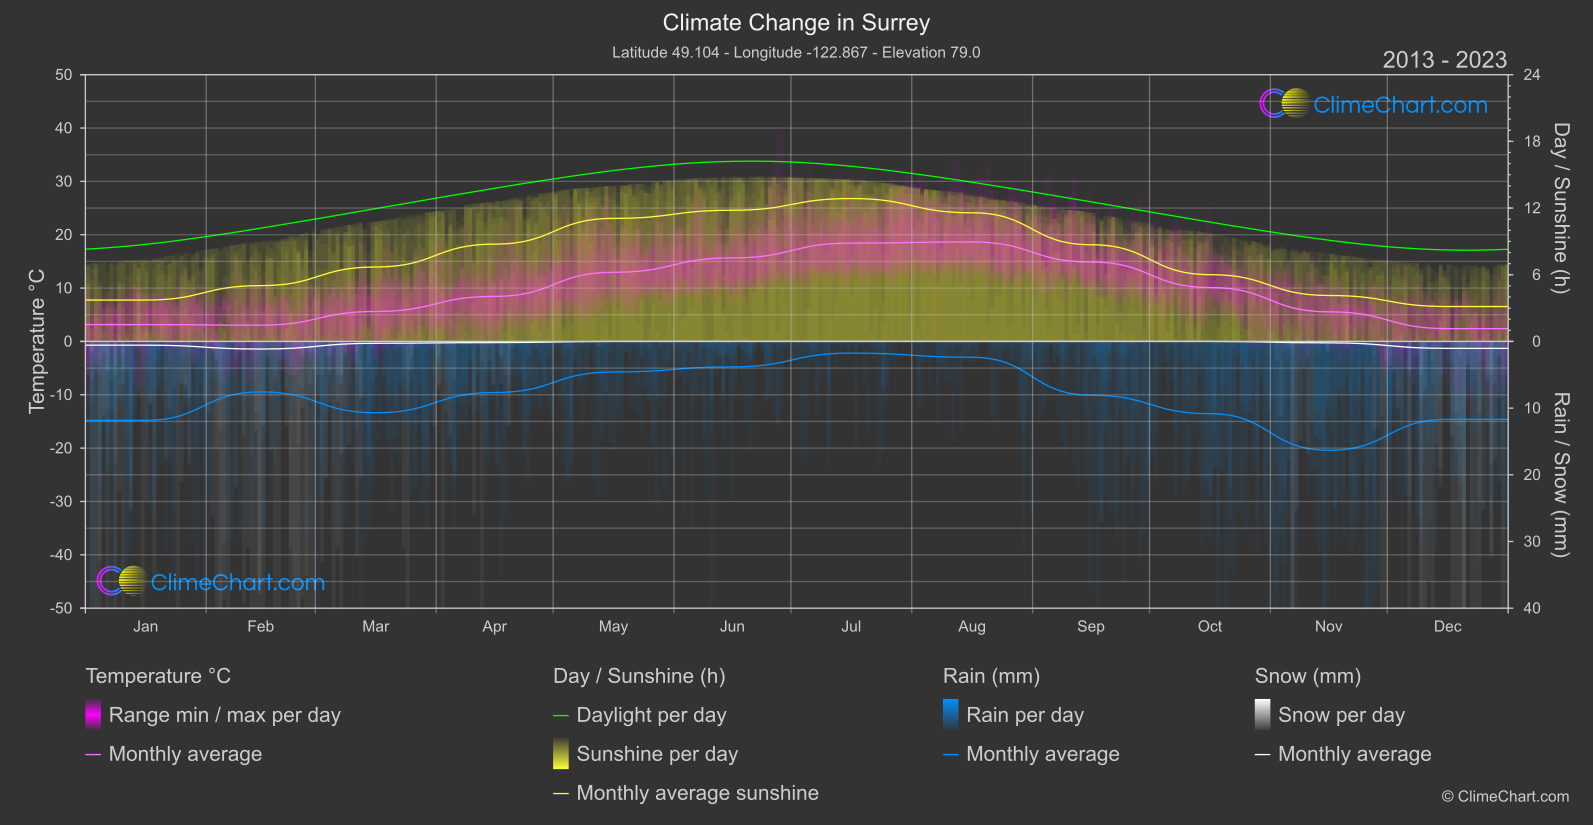
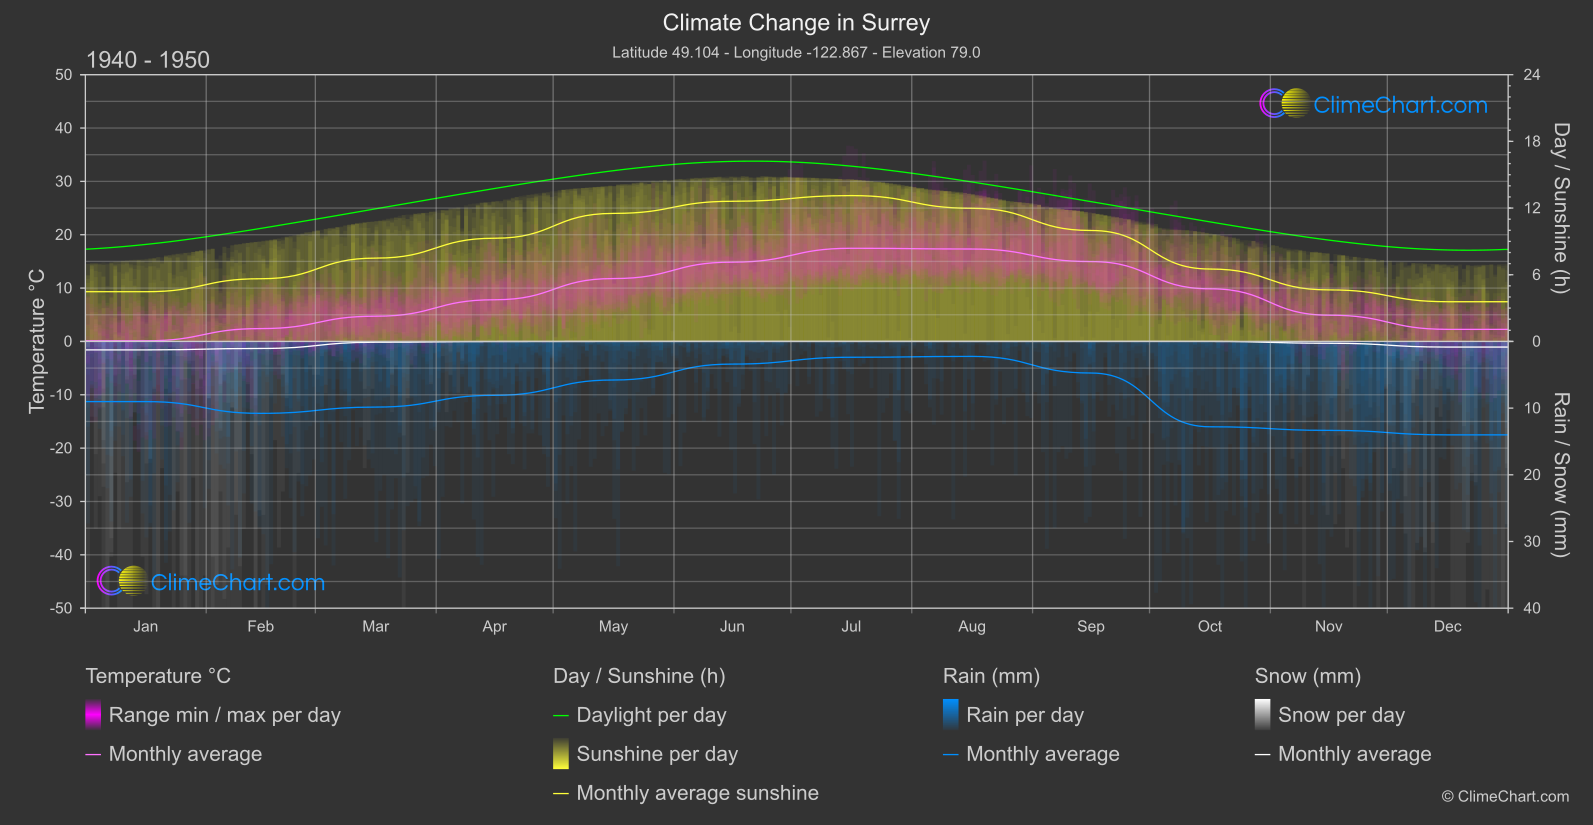
Surrey, Canada has experienced noticeable changes in its climate over the years. The data shows that the month of September has seen a slight decrease in temperature, while the month of August has witnessed the highest increase in temperature. In terms of rainfall, November stands out with a significant increase in precipitation levels. Snowfall has generally decreased over the years, with March showing a notable increase in snowfall. Sunshine duration has also shown a decrease, with September experiencing the most significant drop in sunshine hours.
Climate Change Data Overview for Surrey, Canada
Explore the comprehensive climate change data for Surrey, Canada. This detailed table provides valuable insights into temperature variations, precipitation levels, and seasonal changes influenced by climate change, helping you understand the unique weather patterns of this region.
Temperature °C
| Month | ⌀ 1940 - 1950 | ⌀ 2013 - 2023 | +/- |
|---|---|---|---|
| Jan | 0.12 | 3.16 | 3.04 |
| Feb | 2.41 | 3.05 | 0.64 |
| Mar | 4.73 | 5.62 | 0.89 |
| Apr | 7.81 | 8.44 | 0.63 |
| May | 11.79 | 12.96 | 1.18 |
| Jun | 14.86 | 15.66 | 0.79 |
| Jul | 17.46 | 18.43 | 0.97 |
| Aug | 17.32 | 18.65 | 1.33 |
| Sep | 14.97 | 14.89 | -0.08 |
| Oct | 9.87 | 10.10 | 0.24 |
| Nov | 4.92 | 5.55 | 0.62 |
| Dec | 2.26 | 2.40 | 0.13 |
| ⌀ Month | 9.04 | 9.91 | 0.87 |
Sunshine (h)
| Month | ⌀ 1940 - 1950 | ⌀ 2013 - 2023 | +/- |
|---|---|---|---|
| Jan | 4.47 | 3.72 | -0.75 |
| Feb | 5.64 | 5.02 | -0.62 |
| Mar | 7.50 | 6.70 | -0.80 |
| Apr | 9.28 | 8.76 | -0.53 |
| May | 11.52 | 11.07 | -0.45 |
| Jun | 12.61 | 11.80 | -0.81 |
| Jul | 13.12 | 12.86 | -0.27 |
| Aug | 11.98 | 11.57 | -0.41 |
| Sep | 9.98 | 8.70 | -1.28 |
| Oct | 6.51 | 6.01 | -0.51 |
| Nov | 4.64 | 4.13 | -0.50 |
| Dec | 3.57 | 3.14 | -0.43 |
| ⌀ Month | 8.40 | 7.79 | -0.61 |
Rain (mm)
| Month | ⌀ 1940 - 1950 | ⌀ 2013 - 2023 | +/- |
|---|---|---|---|
| Jan | 4.51 | 5.91 | 1.40 |
| Feb | 5.39 | 3.78 | -1.61 |
| Mar | 4.92 | 5.35 | 0.42 |
| Apr | 4.04 | 3.83 | -0.21 |
| May | 2.89 | 2.29 | -0.60 |
| Jun | 1.70 | 1.91 | 0.21 |
| Jul | 1.19 | 0.87 | -0.31 |
| Aug | 1.12 | 1.19 | 0.07 |
| Sep | 2.37 | 4.03 | 1.66 |
| Oct | 6.40 | 5.42 | -0.98 |
| Nov | 6.67 | 8.16 | 1.49 |
| Dec | 7.01 | 5.84 | -1.16 |
| ⌀ Month | 4.02 | 4.05 | 0.03 |
Snow (mm)
| Month | ⌀ 1940 - 1950 | ⌀ 2013 - 2023 | +/- |
|---|---|---|---|
| Jan | 0.63 | 0.28 | -0.36 |
| Feb | 0.53 | 0.57 | 0.04 |
| Mar | 0.06 | 0.14 | 0.08 |
| Apr | 0.01 | 0.09 | 0.08 |
| May | 0.00 | 0.00 | 0.00 |
| Jun | 0.00 | 0.00 | 0.00 |
| Jul | 0.00 | 0.00 | 0.00 |
| Aug | 0.00 | 0.00 | 0.00 |
| Sep | 0.00 | 0.00 | 0.00 |
| Oct | 0.00 | 0.00 | 0.00 |
| Nov | 0.14 | 0.11 | -0.03 |
| Dec | 0.42 | 0.52 | 0.10 |
| ⌀ Month | 0.15 | 0.14 | -0.01 |