Climate Chart of New York City, USA
Comprehensive Climate Chart of New York City, USA: Monthly Averages and Weather Trends
Welcome to New York City, USA! Discover the climate and weather of this vibrant metropolis.
New York City experiences a humid subtropical climate with hot summers and cold winters. Summers are typically warm and humid, with occasional heatwaves. Winters are cold and snowy, with temperatures often dropping below freezing. Spring and fall offer pleasant temperatures and colorful foliage. The city also experiences occasional storms and hurricanes, especially in late summer and early fall.
Best Travel Time Guide for New York City, USA: Ideal Seasons and Weather Insights
The best time to travel to New York City is in the spring (April to June) and fall (September to November) when the weather is mild and pleasant. Summer (July to August) can be hot and humid, while winter (December to February) can be cold and snowy. Consider visiting during the festive holiday season in December for a magical experience.
Climate Data Overview for New York City, USA
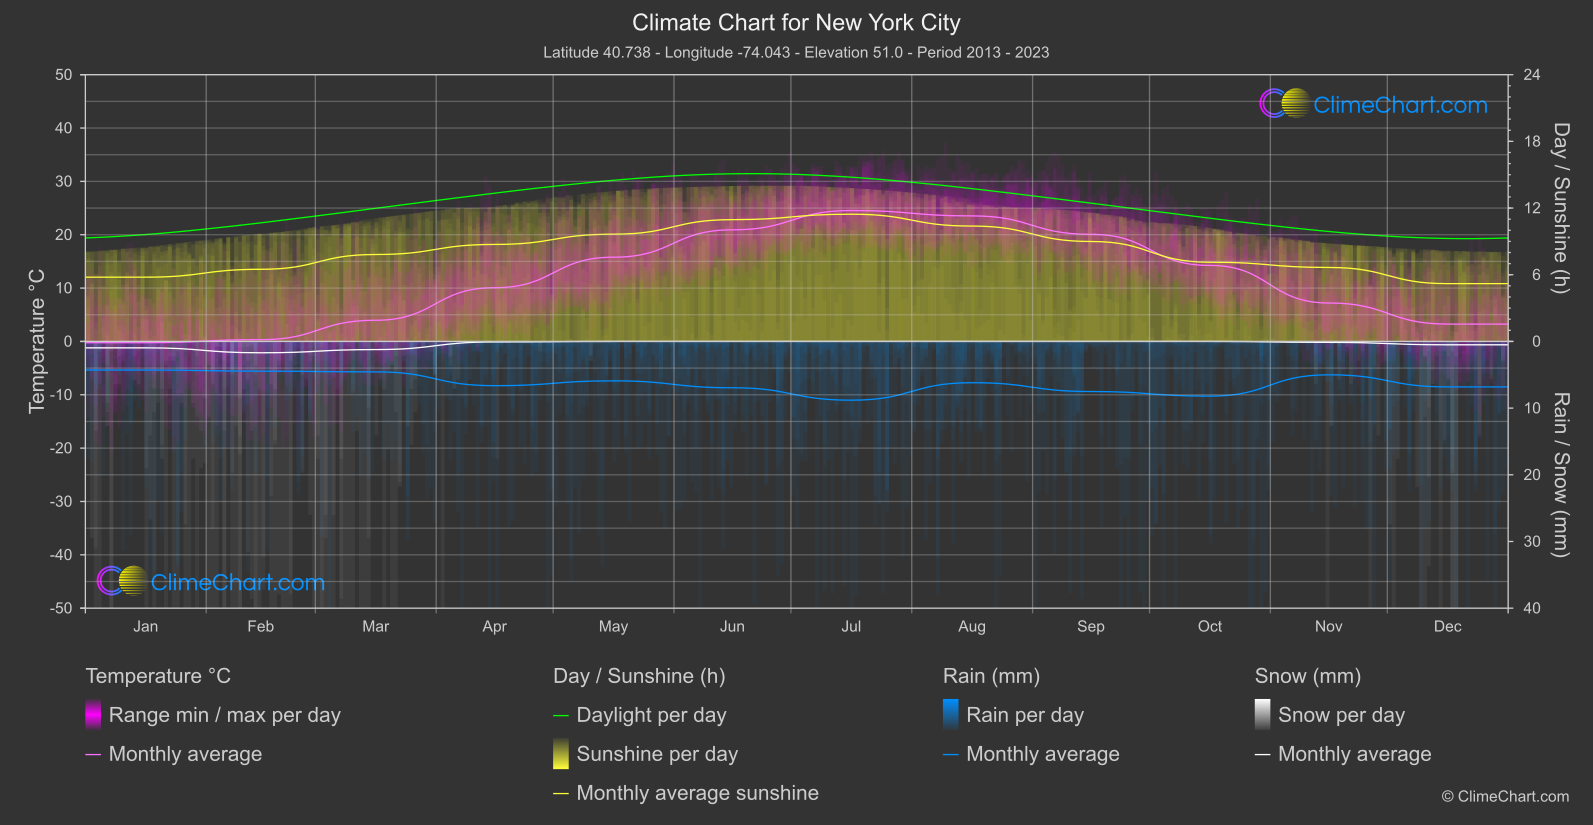
Explore the comprehensive climate data for New York City, USA. This detailed table provides valuable insights into temperature variations, precipitation levels, and seasonal changes, helping you understand the unique weather patterns of this region.
| Month | ⌀ Temperature °C | ⌀ Rain (mm) | ⌀ Snow (mm) | ⌀ Sunshine (h) |
|---|---|---|---|---|
| Jan | -0.2 | 2.14 | 0.48 | 5.78 |
| Feb | 0.3 | 2.23 | 0.85 | 6.49 |
| Mar | 4.0 | 2.28 | 0.61 | 7.82 |
| Apr | 10.1 | 3.32 | 0.04 | 8.73 |
| May | 15.8 | 2.96 | 0.00 | 9.65 |
| Jun | 20.9 | 3.47 | 0.00 | 10.96 |
| Jul | 24.5 | 4.40 | 0.00 | 11.45 |
| Aug | 23.5 | 3.10 | 0.00 | 10.38 |
| Sep | 20.1 | 3.76 | 0.00 | 8.99 |
| Oct | 14.2 | 4.10 | 0.00 | 7.13 |
| Nov | 7.2 | 2.50 | 0.07 | 6.65 |
| Dec | 3.3 | 3.41 | 0.25 | 5.20 |
| ⌀ Month | 12.0 | 3.14 | 0.19 | 8.27 |