Climate Chart of Vancouver, Canada
Comprehensive Climate Chart of Vancouver, Canada: Monthly Averages and Weather Trends
Discover the Climate of Vancouver, Canada
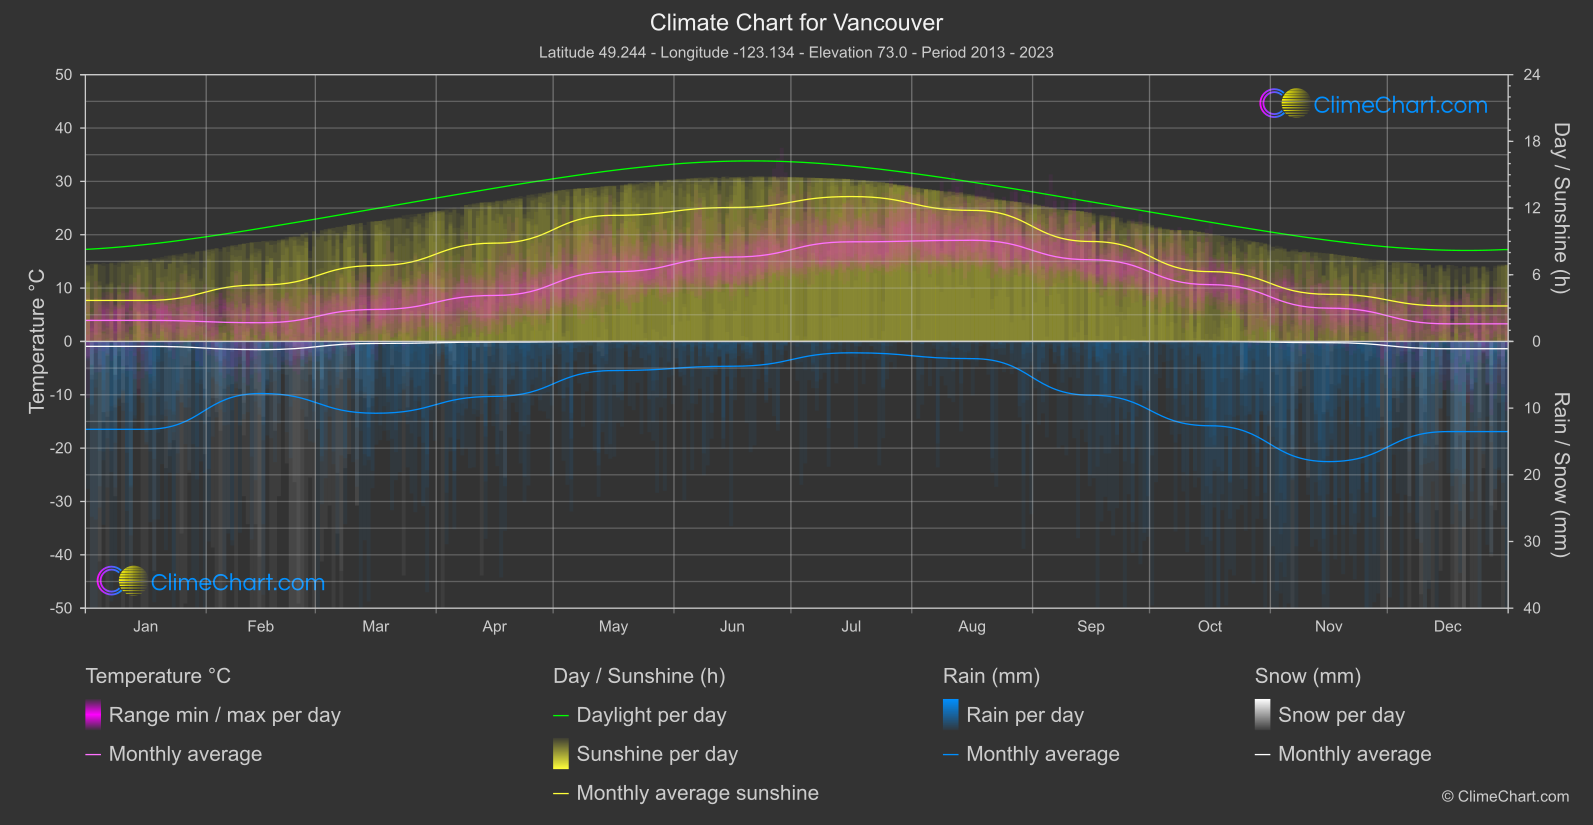
Vancouver, located in British Columbia, Canada, experiences a temperate oceanic climate with mild, wet winters and warm, dry summers. The city is known for its moderate year-round temperatures and lush greenery. Rainfall is common throughout the year, with the wettest months being November to March. Snowfall is rare in the city itself but can be seen in nearby mountain areas.
Best Travel Time Guide for Vancouver, Canada: Ideal Seasons and Weather Insights
The best time to visit Vancouver is during the summer months from June to August when the weather is warm and dry, perfect for exploring the city and its outdoor activities. Spring and fall are also good times to visit as the temperatures are mild and the city is less crowded. Winter can be rainy and cool, but it's a great time to enjoy winter sports in the nearby mountains.
Climate Data Overview for Vancouver, Canada
Explore the comprehensive climate data for Vancouver, Canada. This detailed table provides valuable insights into temperature variations, precipitation levels, and seasonal changes, helping you understand the unique weather patterns of this region.
| Month | ⌀ Temperature °C | ⌀ Rain (mm) | ⌀ Snow (mm) | ⌀ Sunshine (h) |
|---|---|---|---|---|
| Jan | 3.9 | 6.59 | 0.37 | 3.69 |
| Feb | 3.5 | 3.90 | 0.61 | 5.08 |
| Mar | 6.0 | 5.38 | 0.15 | 6.83 |
| Apr | 8.6 | 4.12 | 0.05 | 8.84 |
| May | 13.1 | 2.18 | 0.00 | 11.35 |
| Jun | 15.8 | 1.86 | 0.00 | 12.05 |
| Jul | 18.7 | 0.85 | 0.00 | 13.03 |
| Aug | 19.0 | 1.29 | 0.00 | 11.79 |
| Sep | 15.3 | 4.03 | 0.00 | 8.99 |
| Oct | 10.6 | 6.32 | 0.00 | 6.28 |
| Nov | 6.2 | 9.01 | 0.09 | 4.24 |
| Dec | 3.3 | 6.76 | 0.55 | 3.19 |
| ⌀ Month | 10.3 | 4.36 | 0.15 | 7.95 |