Climate Change Chart of Quebec City, Canada
Comprehensive Climate Change Chart of Quebec City, Canada: Monthly Averages and Impact Trends
Exploring the changing climate in Quebec City, Canada.
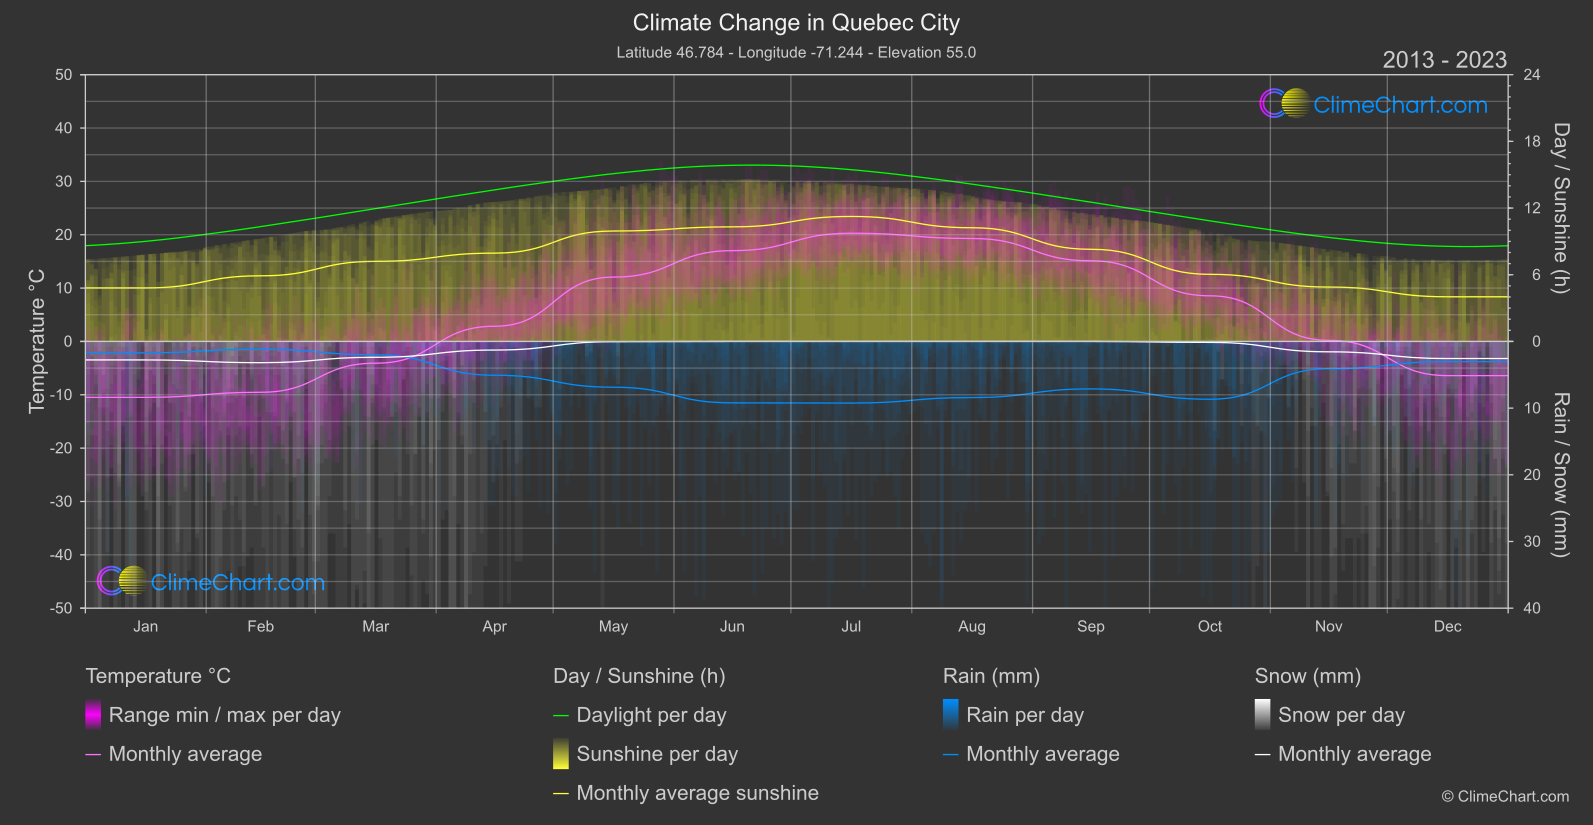
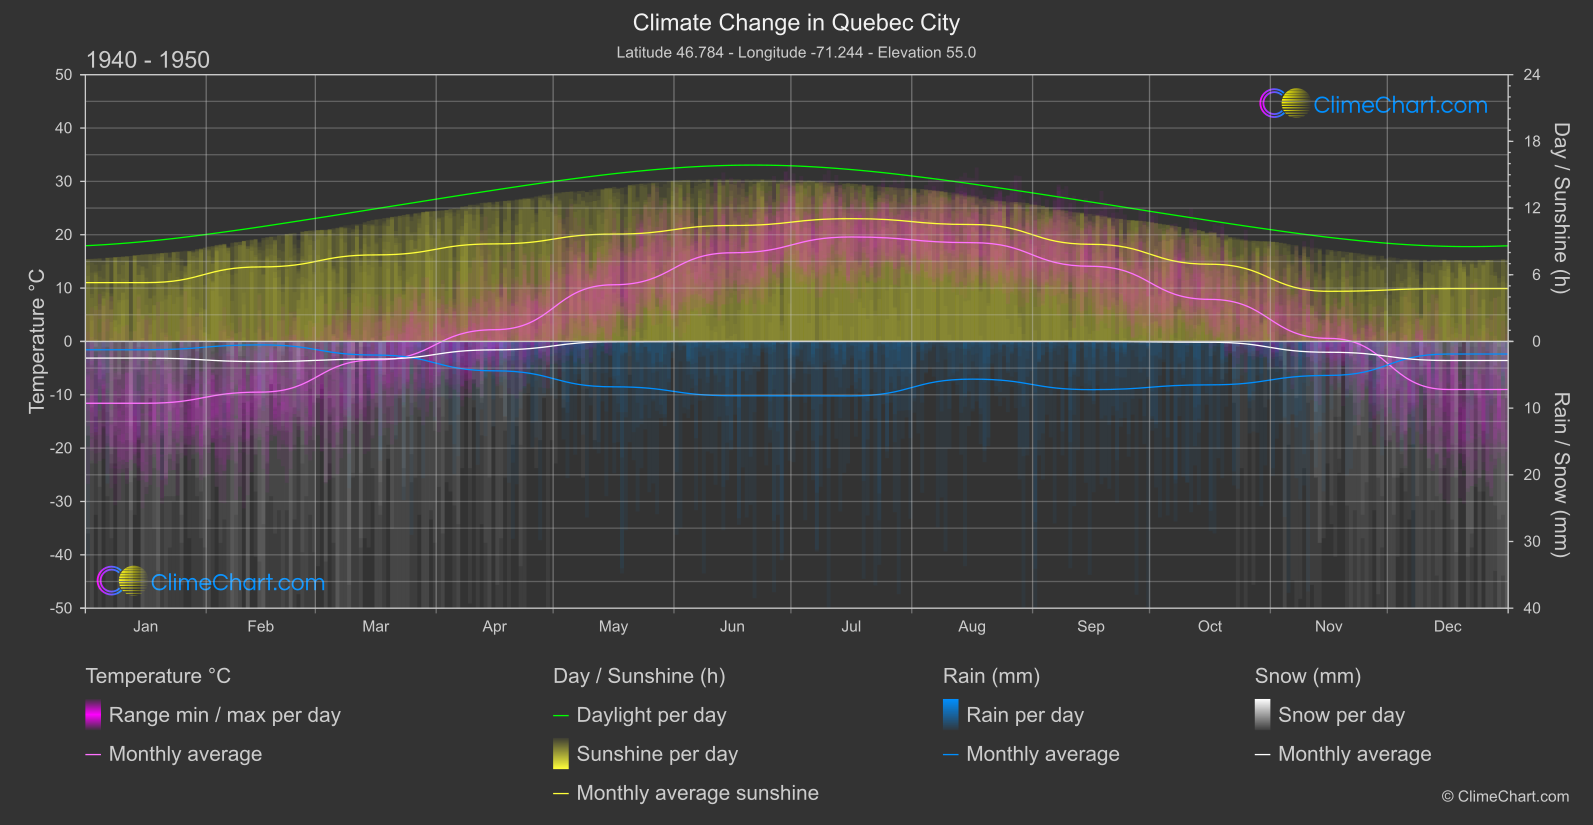
Quebec City, Canada, has experienced significant changes in its climate over the years. From temperature fluctuations to alterations in rainfall patterns, the data reveals a clear impact of climate change. For instance, analyzing the temperature data from 1940-1950 compared to 2013-2024, we observe varying shifts in different months. One interesting finding is that the month of September shows a notable increase in temperature over the years. Additionally, when examining the rainfall data, it is evident that August has experienced a substantial rise in precipitation. These insights highlight the dynamic nature of Quebec City's climate and the need for continued monitoring and adaptation.
Climate Change Data Overview for Quebec City, Canada
Explore the comprehensive climate change data for Quebec City, Canada. This detailed table provides valuable insights into temperature variations, precipitation levels, and seasonal changes influenced by climate change, helping you understand the unique weather patterns of this region.
Temperature °C
| Month | ⌀ 1940 - 1950 | ⌀ 2013 - 2023 | +/- |
|---|---|---|---|
| Jan | -11.59 | -10.48 | 1.11 |
| Feb | -9.50 | -9.53 | -0.03 |
| Mar | -3.46 | -4.08 | -0.62 |
| Apr | 2.20 | 2.85 | 0.65 |
| May | 10.62 | 12.06 | 1.44 |
| Jun | 16.62 | 17.01 | 0.40 |
| Jul | 19.58 | 20.29 | 0.71 |
| Aug | 18.51 | 19.29 | 0.78 |
| Sep | 14.09 | 15.11 | 1.03 |
| Oct | 7.88 | 8.55 | 0.67 |
| Nov | 0.57 | 0.20 | -0.37 |
| Dec | -9.01 | -6.41 | 2.60 |
| ⌀ Month | 4.71 | 5.41 | 0.70 |
Sunshine (h)
| Month | ⌀ 1940 - 1950 | ⌀ 2013 - 2023 | +/- |
|---|---|---|---|
| Jan | 5.29 | 4.81 | -0.48 |
| Feb | 6.70 | 5.90 | -0.80 |
| Mar | 7.79 | 7.20 | -0.58 |
| Apr | 8.78 | 7.94 | -0.83 |
| May | 9.66 | 9.93 | 0.28 |
| Jun | 10.43 | 10.31 | -0.12 |
| Jul | 11.04 | 11.24 | 0.20 |
| Aug | 10.52 | 10.23 | -0.29 |
| Sep | 8.74 | 8.29 | -0.45 |
| Oct | 6.95 | 6.04 | -0.91 |
| Nov | 4.51 | 4.89 | 0.38 |
| Dec | 4.76 | 4.02 | -0.74 |
| ⌀ Month | 7.93 | 7.57 | -0.36 |
Rain (mm)
| Month | ⌀ 1940 - 1950 | ⌀ 2013 - 2023 | +/- |
|---|---|---|---|
| Jan | 0.62 | 0.85 | 0.23 |
| Feb | 0.26 | 0.58 | 0.32 |
| Mar | 1.02 | 1.00 | -0.02 |
| Apr | 2.20 | 2.54 | 0.33 |
| May | 3.40 | 3.43 | 0.03 |
| Jun | 4.07 | 4.61 | 0.53 |
| Jul | 4.08 | 4.62 | 0.54 |
| Aug | 2.83 | 4.21 | 1.38 |
| Sep | 3.61 | 3.56 | -0.05 |
| Oct | 3.26 | 4.33 | 1.08 |
| Nov | 2.55 | 2.05 | -0.50 |
| Dec | 0.95 | 1.52 | 0.57 |
| ⌀ Month | 2.40 | 2.77 | 0.37 |
Snow (mm)
| Month | ⌀ 1940 - 1950 | ⌀ 2013 - 2023 | +/- |
|---|---|---|---|
| Jan | 1.25 | 1.39 | 0.14 |
| Feb | 1.51 | 1.59 | 0.08 |
| Mar | 1.32 | 1.19 | -0.13 |
| Apr | 0.63 | 0.65 | 0.01 |
| May | 0.02 | 0.02 | -0.00 |
| Jun | 0.00 | 0.00 | 0.00 |
| Jul | 0.00 | 0.00 | 0.00 |
| Aug | 0.00 | 0.00 | 0.00 |
| Sep | 0.00 | 0.00 | 0.00 |
| Oct | 0.06 | 0.07 | 0.01 |
| Nov | 0.81 | 0.78 | -0.03 |
| Dec | 1.43 | 1.28 | -0.15 |
| ⌀ Month | 0.59 | 0.58 | -0.01 |