Climate Change Chart of Victoria, Canada
Comprehensive Climate Change Chart of Victoria, Canada: Monthly Averages and Impact Trends
Exploring the climate change in Victoria, Canada reveals intriguing trends in temperature, rainfall, snowfall, and sunshine duration over the years.
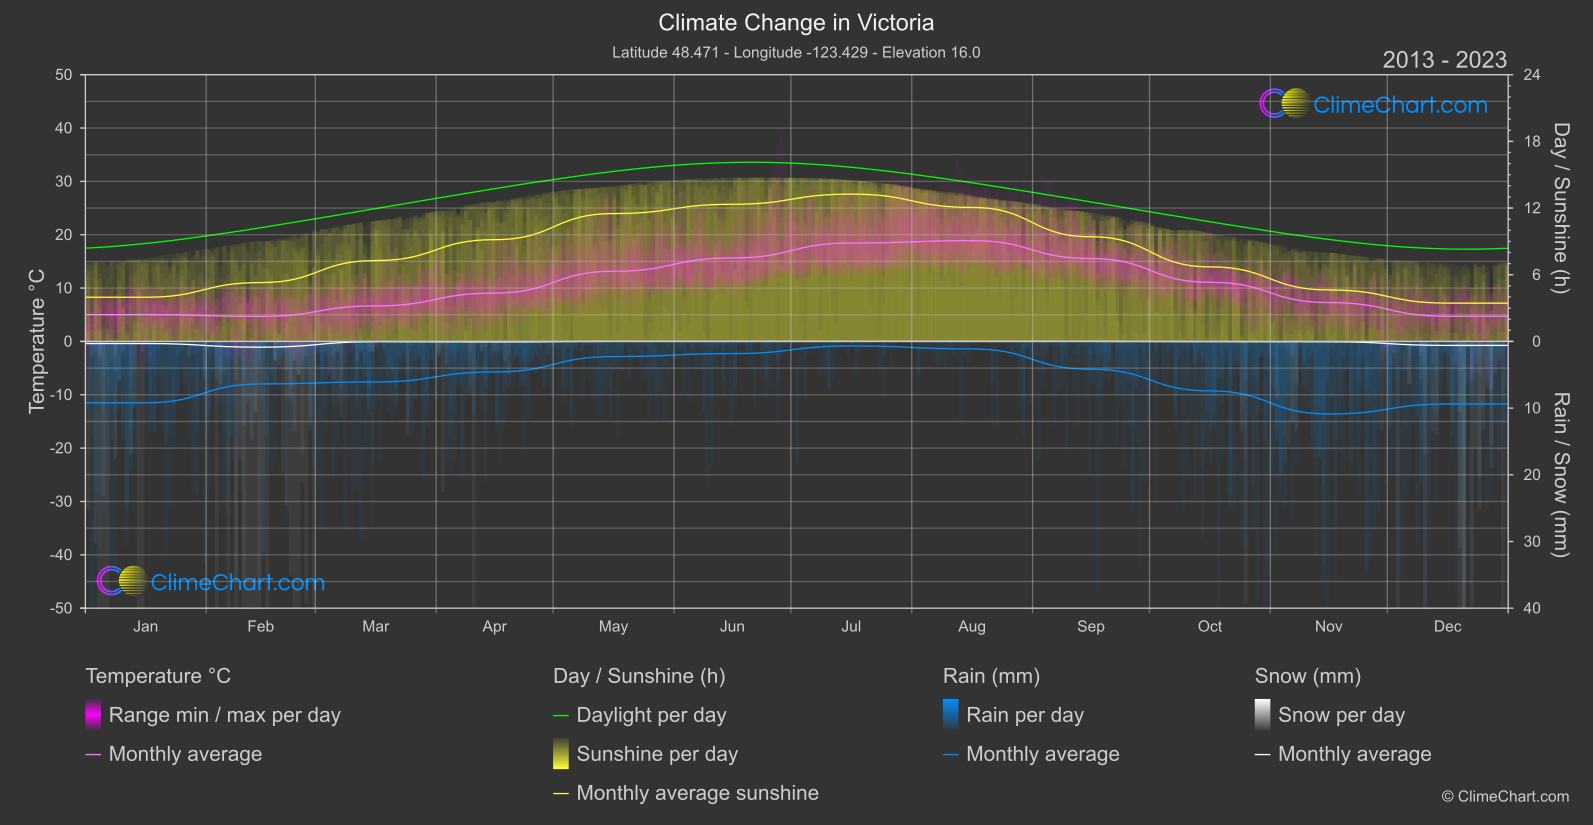
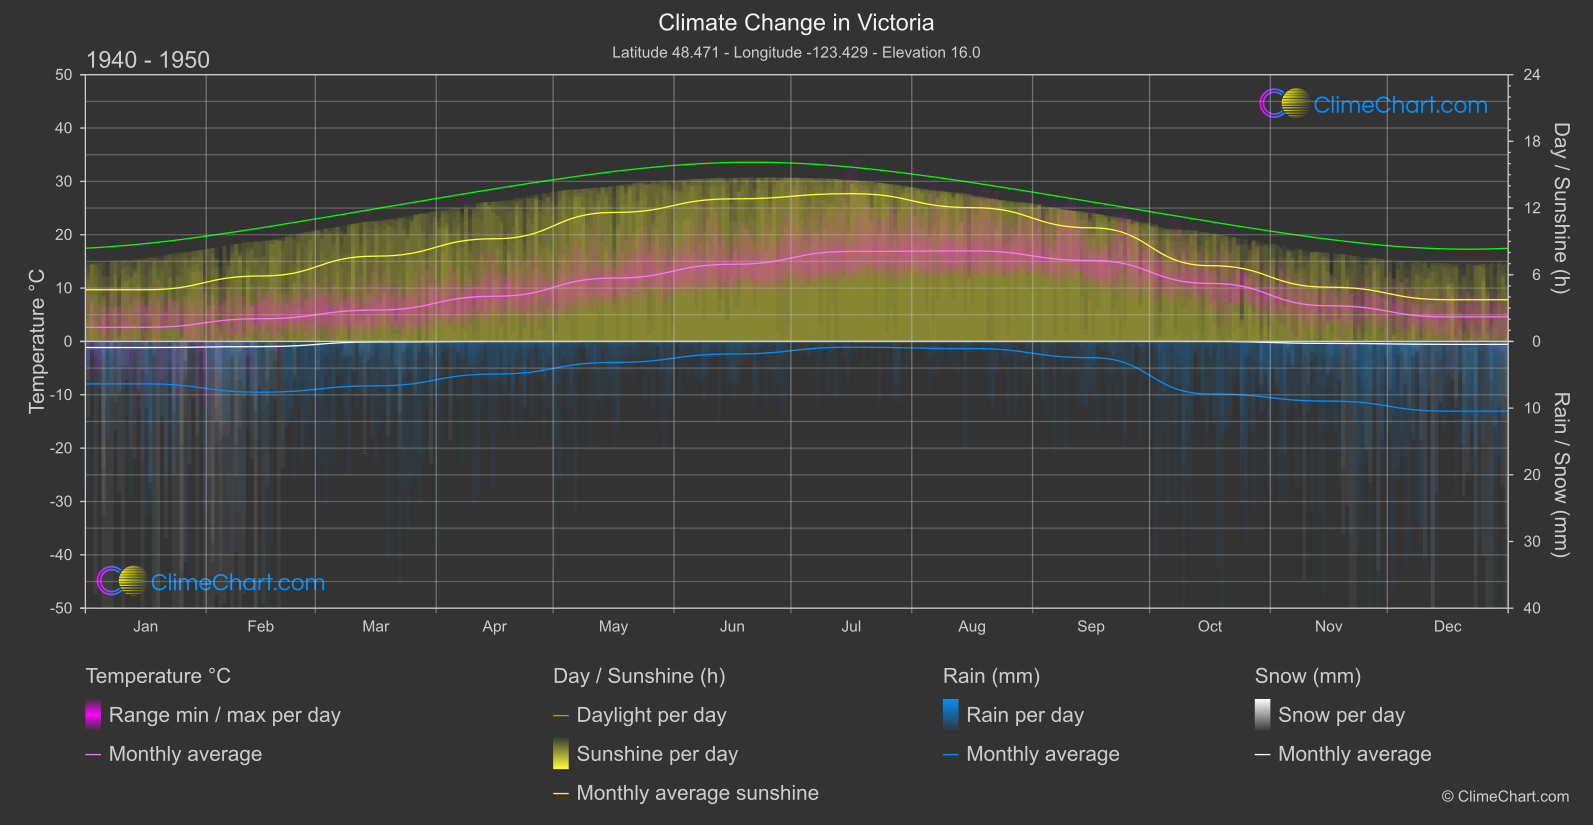
Victoria, Canada experiences notable changes in climate elements such as temperature, rainfall, snowfall, and sunshine duration. The data from 1940-1950 compared to 2013-2024 reveals a consistent increase in average temperatures across most months. Interestingly, July and August show the highest temperature changes, indicating a significant shift in the summer climate. In terms of rainfall, the data shows varied changes throughout the year, with notable increases in September and November. Snowfall has decreased in many months, with October showing a significant drop. Sunshine duration has seen fluctuations, with notable decreases in November and December.
Climate Change Data Overview for Victoria, Canada
Explore the comprehensive climate change data for Victoria, Canada. This detailed table provides valuable insights into temperature variations, precipitation levels, and seasonal changes influenced by climate change, helping you understand the unique weather patterns of this region.
Temperature °C
| Month | ⌀ 1940 - 1950 | ⌀ 2013 - 2023 | +/- |
|---|---|---|---|
| Jan | 2.65 | 5.02 | 2.38 |
| Feb | 4.25 | 4.69 | 0.43 |
| Mar | 5.88 | 6.66 | 0.79 |
| Apr | 8.47 | 9.06 | 0.60 |
| May | 11.87 | 13.16 | 1.28 |
| Jun | 14.46 | 15.65 | 1.19 |
| Jul | 16.87 | 18.45 | 1.58 |
| Aug | 16.96 | 18.89 | 1.93 |
| Sep | 15.17 | 15.54 | 0.36 |
| Oct | 10.88 | 11.09 | 0.21 |
| Nov | 6.68 | 7.28 | 0.60 |
| Dec | 4.60 | 4.71 | 0.11 |
| ⌀ Month | 9.89 | 10.85 | 0.95 |
Sunshine (h)
| Month | ⌀ 1940 - 1950 | ⌀ 2013 - 2023 | +/- |
|---|---|---|---|
| Jan | 4.65 | 3.98 | -0.68 |
| Feb | 5.89 | 5.30 | -0.59 |
| Mar | 7.67 | 7.28 | -0.40 |
| Apr | 9.24 | 9.16 | -0.08 |
| May | 11.60 | 11.50 | -0.10 |
| Jun | 12.83 | 12.34 | -0.49 |
| Jul | 13.29 | 13.25 | -0.04 |
| Aug | 12.04 | 12.06 | 0.02 |
| Sep | 10.22 | 9.41 | -0.81 |
| Oct | 6.82 | 6.71 | -0.11 |
| Nov | 4.88 | 4.63 | -0.25 |
| Dec | 3.75 | 3.45 | -0.31 |
| ⌀ Month | 8.57 | 8.25 | -0.32 |
Rain (mm)
| Month | ⌀ 1940 - 1950 | ⌀ 2013 - 2023 | +/- |
|---|---|---|---|
| Jan | 3.18 | 4.60 | 1.42 |
| Feb | 3.81 | 3.18 | -0.62 |
| Mar | 3.33 | 3.04 | -0.29 |
| Apr | 2.45 | 2.29 | -0.16 |
| May | 1.58 | 1.14 | -0.44 |
| Jun | 0.94 | 0.91 | -0.03 |
| Jul | 0.43 | 0.34 | -0.09 |
| Aug | 0.54 | 0.56 | 0.02 |
| Sep | 1.21 | 2.09 | 0.87 |
| Oct | 3.94 | 3.71 | -0.23 |
| Nov | 4.47 | 5.44 | 0.97 |
| Dec | 5.23 | 4.69 | -0.54 |
| ⌀ Month | 2.59 | 2.67 | 0.07 |
Snow (mm)
| Month | ⌀ 1940 - 1950 | ⌀ 2013 - 2023 | +/- |
|---|---|---|---|
| Jan | 0.46 | 0.16 | -0.30 |
| Feb | 0.39 | 0.43 | 0.05 |
| Mar | 0.04 | 0.02 | -0.02 |
| Apr | 0.00 | 0.04 | 0.03 |
| May | 0.00 | 0.00 | 0.00 |
| Jun | 0.00 | 0.00 | 0.00 |
| Jul | 0.00 | 0.00 | 0.00 |
| Aug | 0.00 | 0.00 | 0.00 |
| Sep | 0.00 | 0.00 | 0.00 |
| Oct | 0.00 | 0.02 | 0.01 |
| Nov | 0.15 | 0.02 | -0.12 |
| Dec | 0.22 | 0.30 | 0.08 |
| ⌀ Month | 0.10 | 0.08 | -0.02 |