Climate Change Chart of New York City, USA
Comprehensive Climate Change Chart of New York City, USA: Monthly Averages and Impact Trends
Exploring the climate change data of New York City reveals fascinating insights into the shifting weather patterns over the years.
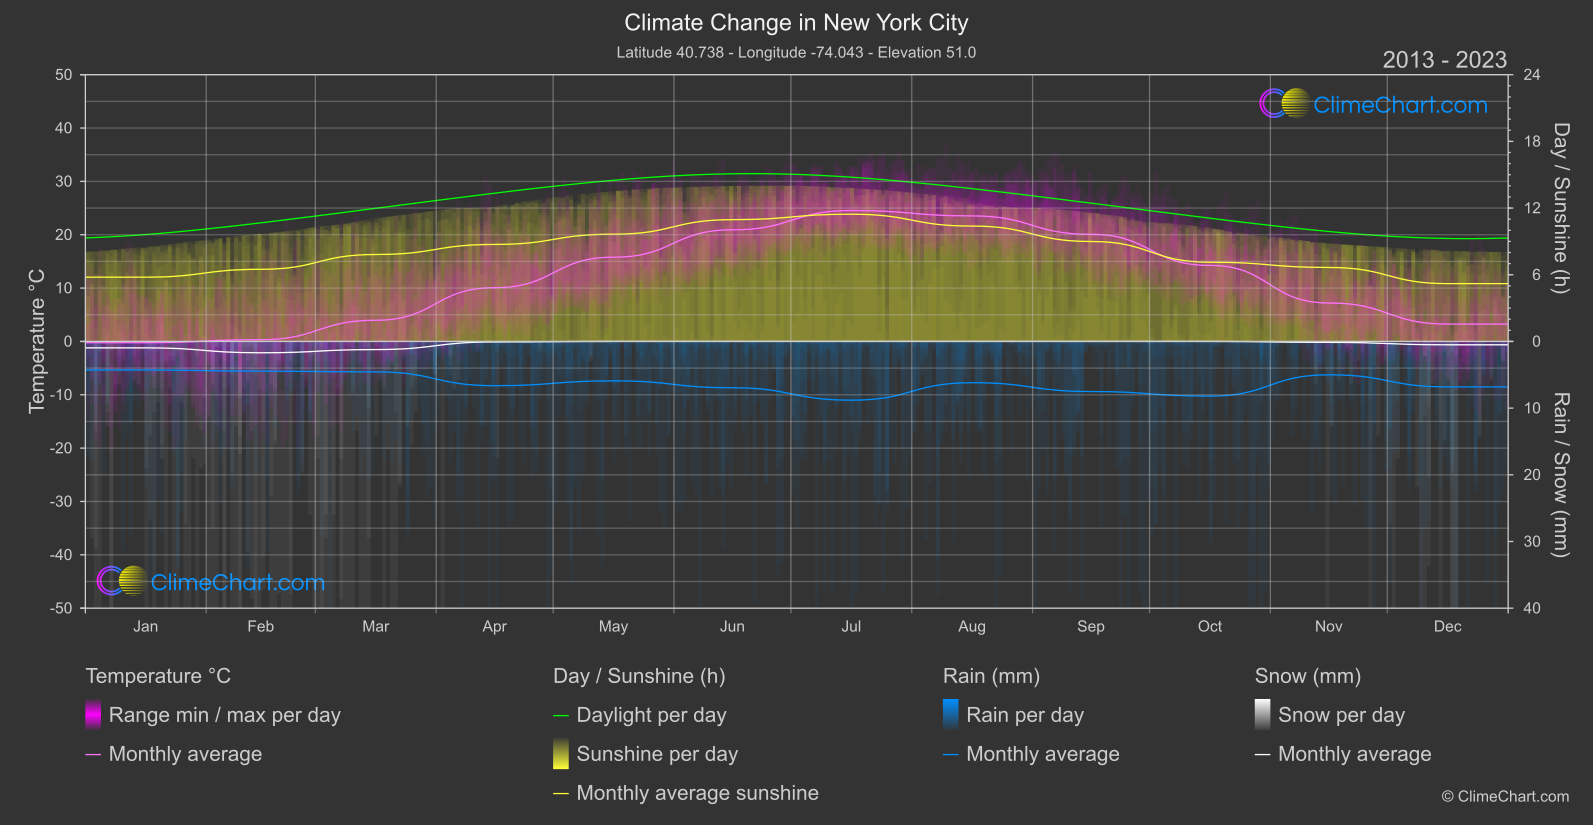
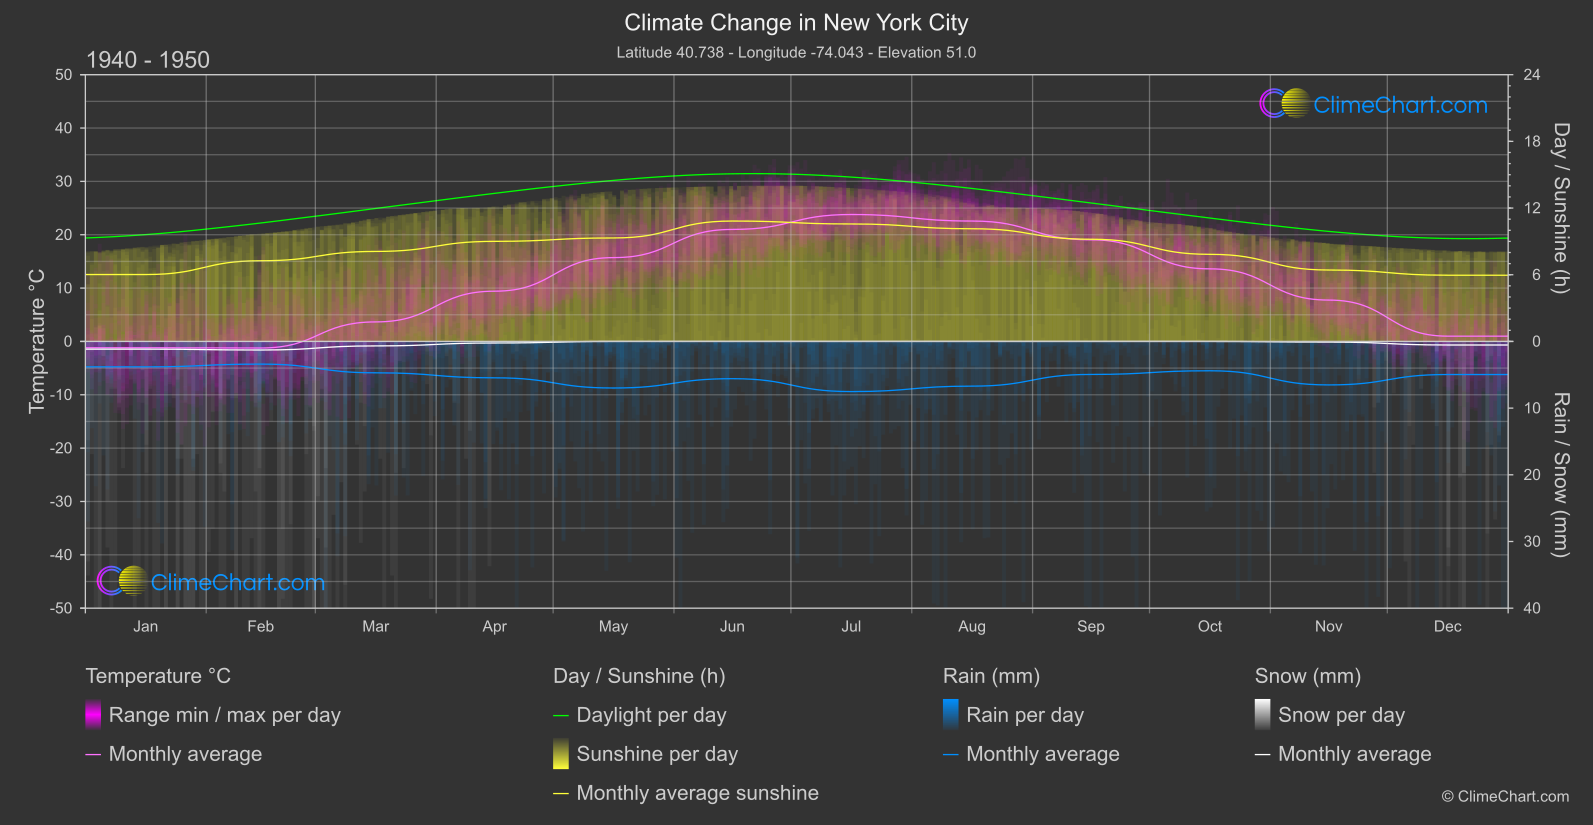
New York City has experienced notable changes in temperature, rainfall, snowfall, and sunshine duration over the years. Analyzing the data from 1940 to 1950 compared to 2013 to 2024, we observe varying patterns in climate metrics. For instance, December shows a significant increase in temperature, while September sees a notable rise in rainfall. The data provides valuable insights into the evolving climate of this iconic city.
Climate Change Data Overview for New York City, USA
Explore the comprehensive climate change data for New York City, USA. This detailed table provides valuable insights into temperature variations, precipitation levels, and seasonal changes influenced by climate change, helping you understand the unique weather patterns of this region.
Temperature °C
| Month | ⌀ 1940 - 1950 | ⌀ 2013 - 2023 | +/- |
|---|---|---|---|
| Jan | -1.18 | -0.23 | 0.95 |
| Feb | -1.23 | 0.33 | 1.56 |
| Mar | 3.66 | 3.97 | 0.31 |
| Apr | 9.42 | 10.07 | 0.66 |
| May | 15.71 | 15.79 | 0.08 |
| Jun | 21.00 | 20.92 | -0.07 |
| Jul | 23.79 | 24.54 | 0.75 |
| Aug | 22.57 | 23.53 | 0.96 |
| Sep | 19.05 | 20.07 | 1.03 |
| Oct | 13.60 | 14.25 | 0.64 |
| Nov | 7.75 | 7.20 | -0.55 |
| Dec | 0.99 | 3.25 | 2.26 |
| ⌀ Month | 11.26 | 11.97 | 0.71 |
Sunshine (h)
| Month | ⌀ 1940 - 1950 | ⌀ 2013 - 2023 | +/- |
|---|---|---|---|
| Jan | 6.02 | 5.78 | -0.24 |
| Feb | 7.26 | 6.49 | -0.77 |
| Mar | 8.10 | 7.82 | -0.28 |
| Apr | 9.00 | 8.73 | -0.28 |
| May | 9.31 | 9.65 | 0.34 |
| Jun | 10.83 | 10.96 | 0.13 |
| Jul | 10.57 | 11.45 | 0.88 |
| Aug | 10.14 | 10.38 | 0.24 |
| Sep | 9.19 | 8.99 | -0.20 |
| Oct | 7.84 | 7.13 | -0.71 |
| Nov | 6.43 | 6.65 | 0.23 |
| Dec | 5.96 | 5.20 | -0.76 |
| ⌀ Month | 8.39 | 8.27 | -0.12 |
Rain (mm)
| Month | ⌀ 1940 - 1950 | ⌀ 2013 - 2023 | +/- |
|---|---|---|---|
| Jan | 1.91 | 2.14 | 0.23 |
| Feb | 1.70 | 2.23 | 0.53 |
| Mar | 2.35 | 2.28 | -0.07 |
| Apr | 2.73 | 3.32 | 0.59 |
| May | 3.49 | 2.96 | -0.54 |
| Jun | 2.79 | 3.47 | 0.68 |
| Jul | 3.76 | 4.40 | 0.64 |
| Aug | 3.35 | 3.10 | -0.26 |
| Sep | 2.47 | 3.76 | 1.28 |
| Oct | 2.20 | 4.10 | 1.90 |
| Nov | 3.26 | 2.50 | -0.76 |
| Dec | 2.48 | 3.41 | 0.93 |
| ⌀ Month | 2.71 | 3.14 | 0.43 |
Snow (mm)
| Month | ⌀ 1940 - 1950 | ⌀ 2013 - 2023 | +/- |
|---|---|---|---|
| Jan | 0.58 | 0.48 | -0.10 |
| Feb | 0.64 | 0.85 | 0.21 |
| Mar | 0.34 | 0.61 | 0.27 |
| Apr | 0.12 | 0.04 | -0.08 |
| May | 0.00 | 0.00 | 0.00 |
| Jun | 0.00 | 0.00 | 0.00 |
| Jul | 0.00 | 0.00 | 0.00 |
| Aug | 0.00 | 0.00 | 0.00 |
| Sep | 0.00 | 0.00 | 0.00 |
| Oct | 0.00 | 0.00 | 0.00 |
| Nov | 0.05 | 0.07 | 0.02 |
| Dec | 0.27 | 0.25 | -0.01 |
| ⌀ Month | 0.17 | 0.19 | 0.03 |