Climate Change Chart of Jasper National Park, Canada
Comprehensive Climate Change Chart of Jasper National Park, Canada: Monthly Averages and Impact Trends
Exploring the climate changes in Jasper National Park, Canada reveals intriguing insights into temperature, rainfall, snowfall, and sunshine duration over the years.
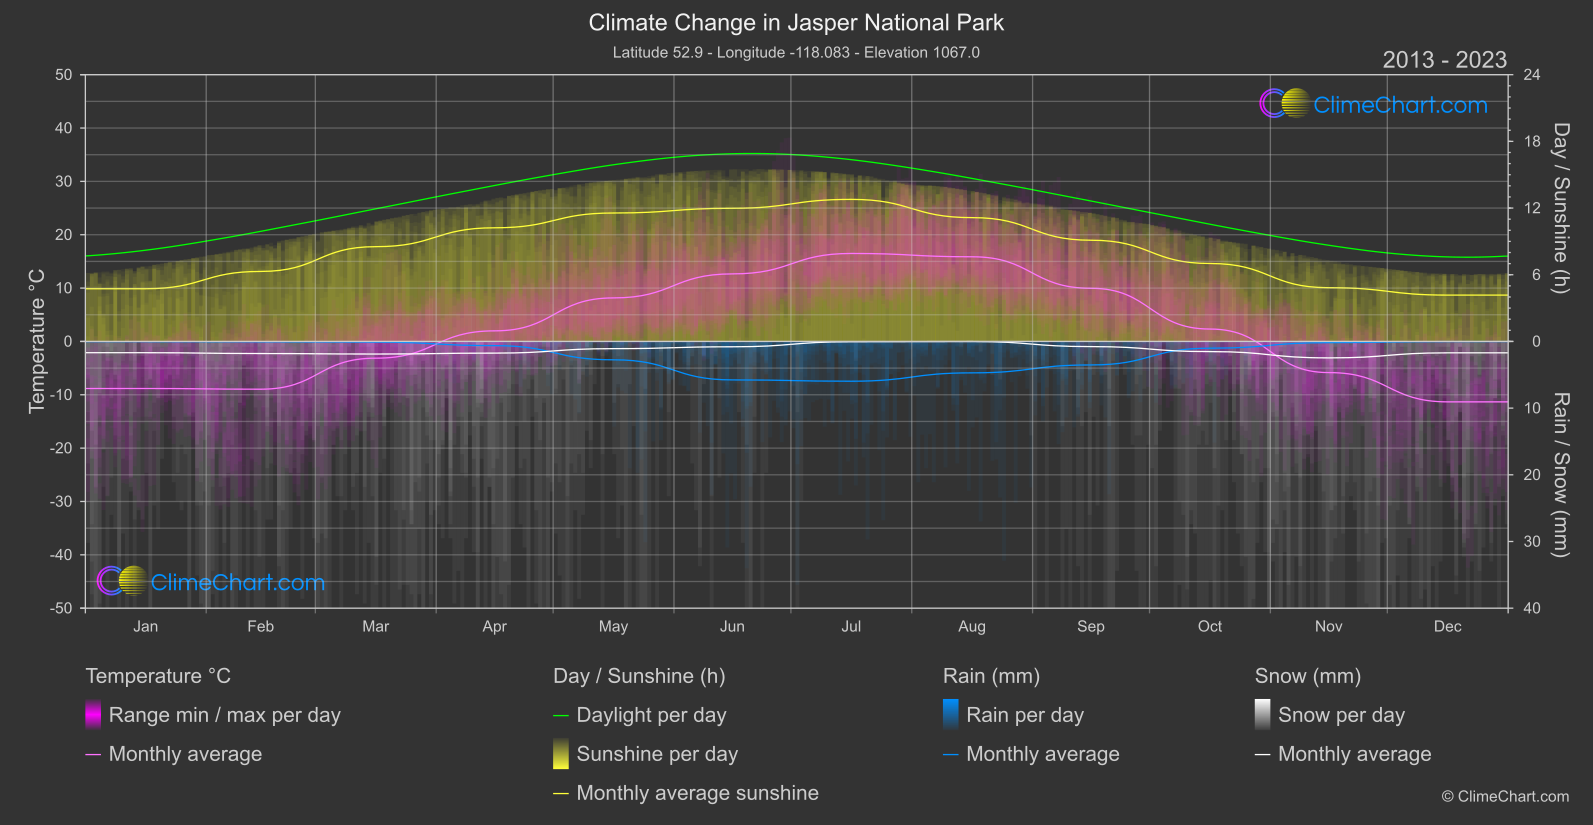
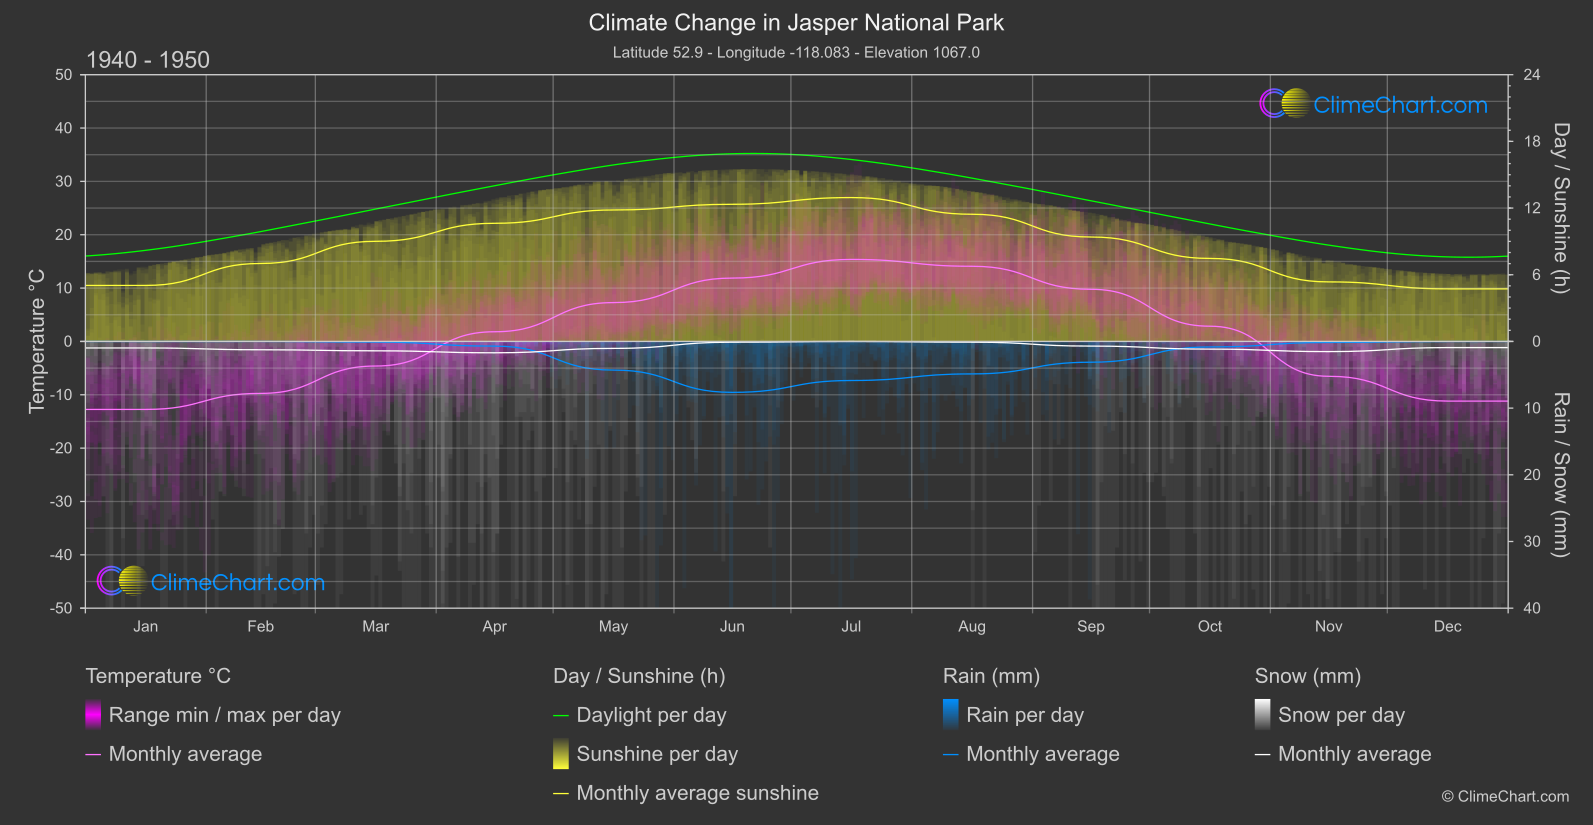
Jasper National Park, located in Canada, has experienced notable changes in climate over the years. The data showcases how temperatures have increased in certain months, with July and August showing the highest temperature rise. On the other hand, rainfall patterns have also shifted, with notable changes in May and June. Snowfall amounts have varied, with significant increases observed in November and December. Additionally, the duration of sunshine has shown fluctuations, especially in the winter months. These insights offer a comprehensive view of the changing climate in Jasper National Park.
Climate Change Data Overview for Jasper National Park, Canada
Explore the comprehensive climate change data for Jasper National Park, Canada. This detailed table provides valuable insights into temperature variations, precipitation levels, and seasonal changes influenced by climate change, helping you understand the unique weather patterns of this region.
Temperature °C
| Month | ⌀ 1940 - 1950 | ⌀ 2013 - 2023 | +/- |
|---|---|---|---|
| Jan | -12.74 | -8.82 | 3.92 |
| Feb | -9.74 | -8.96 | 0.78 |
| Mar | -4.61 | -3.14 | 1.47 |
| Apr | 1.81 | 1.98 | 0.17 |
| May | 7.28 | 8.16 | 0.88 |
| Jun | 11.87 | 12.66 | 0.79 |
| Jul | 15.37 | 16.49 | 1.12 |
| Aug | 14.09 | 15.87 | 1.78 |
| Sep | 9.77 | 9.96 | 0.19 |
| Oct | 2.86 | 2.32 | -0.53 |
| Nov | -6.53 | -5.84 | 0.69 |
| Dec | -11.18 | -11.33 | -0.15 |
| ⌀ Month | 1.52 | 2.45 | 0.93 |
Sunshine (h)
| Month | ⌀ 1940 - 1950 | ⌀ 2013 - 2023 | +/- |
|---|---|---|---|
| Jan | 5.04 | 4.74 | -0.30 |
| Feb | 7.01 | 6.30 | -0.72 |
| Mar | 9.01 | 8.53 | -0.48 |
| Apr | 10.63 | 10.22 | -0.40 |
| May | 11.83 | 11.56 | -0.27 |
| Jun | 12.34 | 11.98 | -0.36 |
| Jul | 12.94 | 12.78 | -0.16 |
| Aug | 11.44 | 11.14 | -0.30 |
| Sep | 9.39 | 9.11 | -0.29 |
| Oct | 7.47 | 7.01 | -0.46 |
| Nov | 5.36 | 4.83 | -0.52 |
| Dec | 4.73 | 4.17 | -0.56 |
| ⌀ Month | 8.93 | 8.53 | -0.40 |
Rain (mm)
| Month | ⌀ 1940 - 1950 | ⌀ 2013 - 2023 | +/- |
|---|---|---|---|
| Jan | 0.00 | 0.02 | 0.01 |
| Feb | 0.00 | 0.03 | 0.03 |
| Mar | 0.05 | 0.05 | 0.00 |
| Apr | 0.35 | 0.31 | -0.04 |
| May | 2.15 | 1.38 | -0.77 |
| Jun | 3.82 | 2.88 | -0.93 |
| Jul | 2.93 | 2.98 | 0.05 |
| Aug | 2.44 | 2.36 | -0.08 |
| Sep | 1.56 | 1.76 | 0.21 |
| Oct | 0.41 | 0.51 | 0.09 |
| Nov | 0.08 | 0.09 | 0.01 |
| Dec | 0.01 | 0.01 | 0.00 |
| ⌀ Month | 1.15 | 1.03 | -0.12 |
Snow (mm)
| Month | ⌀ 1940 - 1950 | ⌀ 2013 - 2023 | +/- |
|---|---|---|---|
| Jan | 0.49 | 0.85 | 0.36 |
| Feb | 0.62 | 0.91 | 0.28 |
| Mar | 0.70 | 0.95 | 0.24 |
| Apr | 0.85 | 0.88 | 0.02 |
| May | 0.52 | 0.54 | 0.02 |
| Jun | 0.06 | 0.40 | 0.34 |
| Jul | 0.00 | 0.02 | 0.02 |
| Aug | 0.06 | 0.01 | -0.05 |
| Sep | 0.35 | 0.39 | 0.04 |
| Oct | 0.58 | 0.76 | 0.19 |
| Nov | 0.76 | 1.23 | 0.47 |
| Dec | 0.46 | 0.86 | 0.39 |
| ⌀ Month | 0.45 | 0.65 | 0.19 |