Climate Change Chart of Beijing, China
Comprehensive Climate Change Chart of Beijing, China: Monthly Averages and Impact Trends
Explore the changing climate in Beijing, China with insightful data analysis. Discover the trends and patterns in temperature, rainfall, snowfall, and sunshine duration over the years.
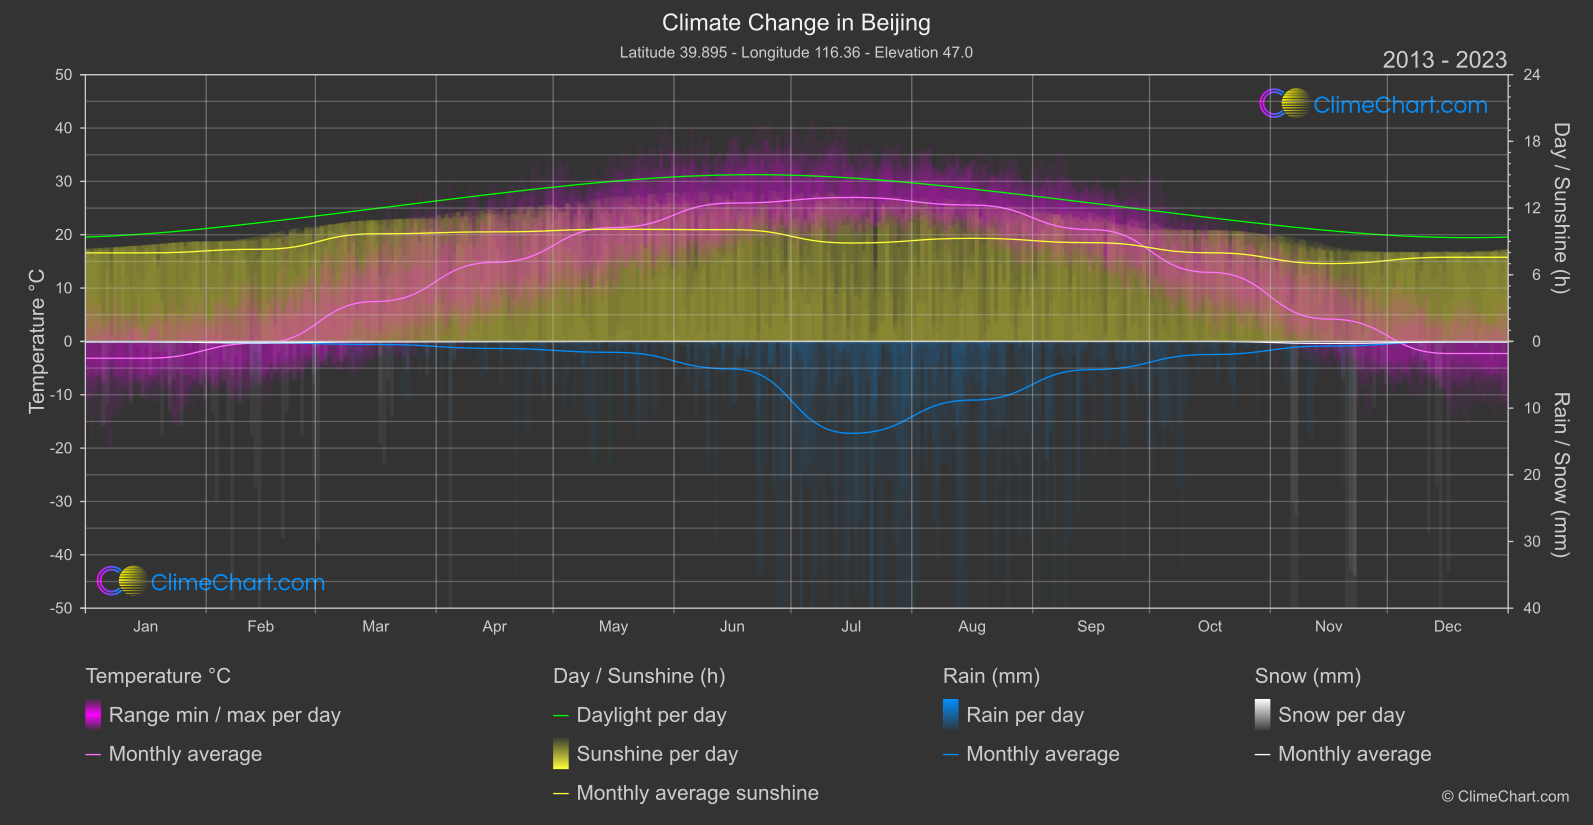
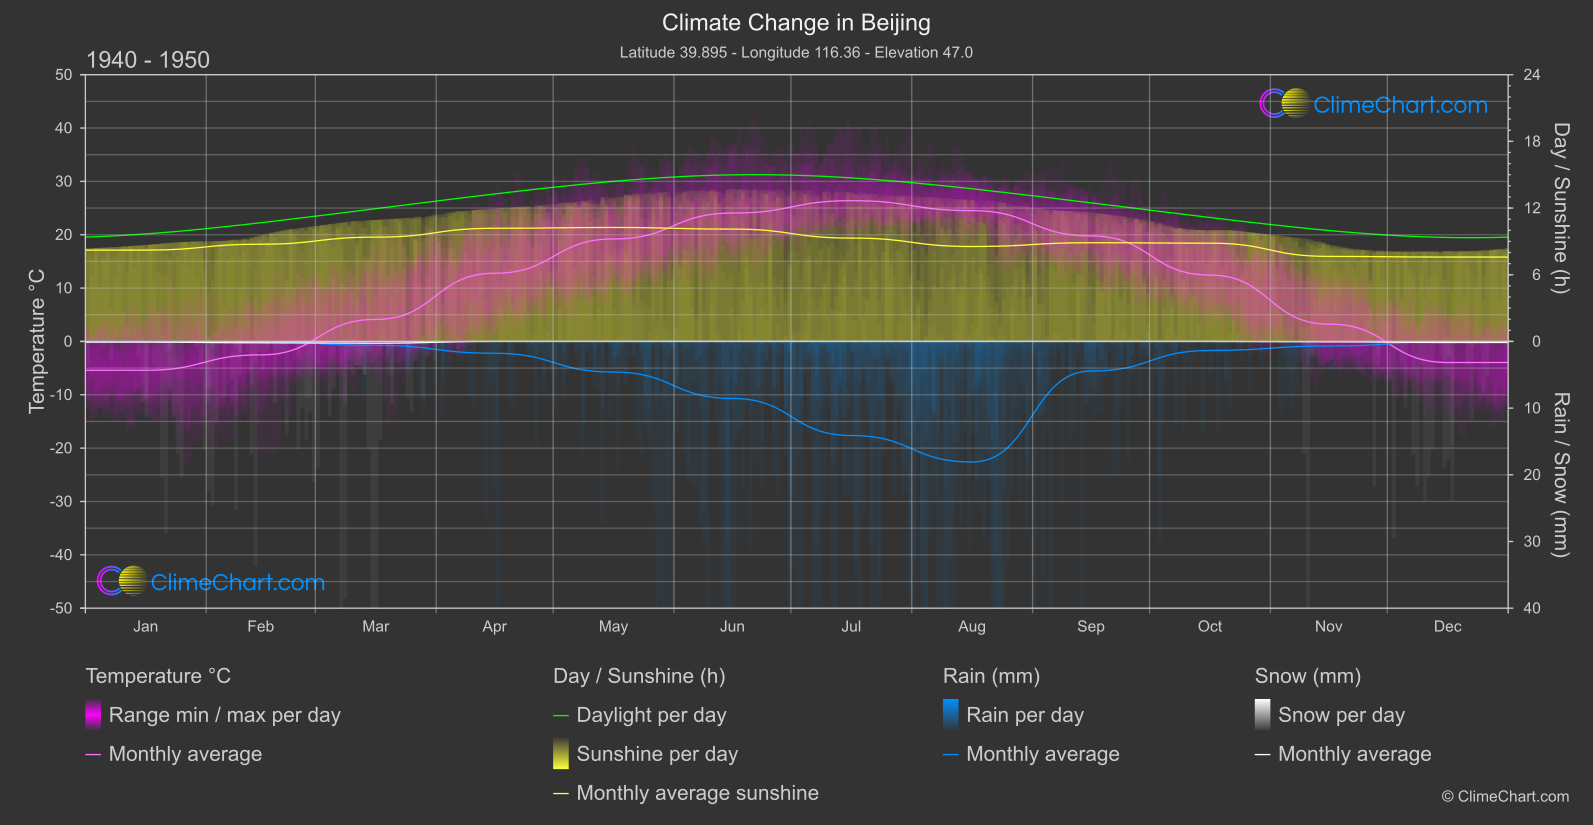
Beijing, the capital city of China, experiences notable changes in climate parameters. From temperature fluctuations to varying rainfall patterns, the data reveals interesting insights. For instance, the month of March shows a significant temperature increase over the years, while August showcases a considerable decrease in rainfall. Understanding these shifts is crucial for climate monitoring and adaptation strategies.
Climate Change Data Overview for Beijing, China
Explore the comprehensive climate change data for Beijing, China. This detailed table provides valuable insights into temperature variations, precipitation levels, and seasonal changes influenced by climate change, helping you understand the unique weather patterns of this region.
Temperature °C
| Month | ⌀ 1940 - 1950 | ⌀ 2013 - 2023 | +/- |
|---|---|---|---|
| Jan | -5.41 | -3.15 | 2.26 |
| Feb | -2.52 | -0.30 | 2.22 |
| Mar | 4.13 | 7.48 | 3.36 |
| Apr | 12.78 | 14.83 | 2.05 |
| May | 19.21 | 21.34 | 2.13 |
| Jun | 24.06 | 25.93 | 1.87 |
| Jul | 26.38 | 26.99 | 0.60 |
| Aug | 24.52 | 25.56 | 1.04 |
| Sep | 19.78 | 20.97 | 1.19 |
| Oct | 12.44 | 12.95 | 0.51 |
| Nov | 3.25 | 4.20 | 0.94 |
| Dec | -3.95 | -2.26 | 1.69 |
| ⌀ Month | 11.22 | 12.88 | 1.66 |
Sunshine (h)
| Month | ⌀ 1940 - 1950 | ⌀ 2013 - 2023 | +/- |
|---|---|---|---|
| Jan | 8.22 | 7.97 | -0.25 |
| Feb | 8.75 | 8.29 | -0.46 |
| Mar | 9.38 | 9.69 | 0.30 |
| Apr | 10.18 | 9.86 | -0.32 |
| May | 10.25 | 10.09 | -0.16 |
| Jun | 10.11 | 10.05 | -0.05 |
| Jul | 9.30 | 8.85 | -0.45 |
| Aug | 8.54 | 9.28 | 0.74 |
| Sep | 8.88 | 8.89 | 0.00 |
| Oct | 8.84 | 7.98 | -0.86 |
| Nov | 7.65 | 7.00 | -0.65 |
| Dec | 7.59 | 7.57 | -0.02 |
| ⌀ Month | 8.97 | 8.79 | -0.18 |
Rain (mm)
| Month | ⌀ 1940 - 1950 | ⌀ 2013 - 2023 | +/- |
|---|---|---|---|
| Jan | 0.00 | 0.01 | 0.01 |
| Feb | 0.02 | 0.11 | 0.08 |
| Mar | 0.29 | 0.22 | -0.07 |
| Apr | 0.89 | 0.52 | -0.36 |
| May | 2.30 | 0.82 | -1.48 |
| Jun | 4.28 | 2.06 | -2.21 |
| Jul | 7.05 | 6.89 | -0.16 |
| Aug | 9.04 | 4.40 | -4.64 |
| Sep | 2.22 | 2.11 | -0.11 |
| Oct | 0.68 | 0.98 | 0.30 |
| Nov | 0.34 | 0.35 | 0.00 |
| Dec | 0.02 | 0.02 | -0.01 |
| ⌀ Month | 2.26 | 1.54 | -0.72 |
Snow (mm)
| Month | ⌀ 1940 - 1950 | ⌀ 2013 - 2023 | +/- |
|---|---|---|---|
| Jan | 0.05 | 0.04 | -0.01 |
| Feb | 0.10 | 0.11 | 0.01 |
| Mar | 0.13 | 0.03 | -0.10 |
| Apr | 0.00 | 0.02 | 0.02 |
| May | 0.00 | 0.00 | 0.00 |
| Jun | 0.00 | 0.00 | 0.00 |
| Jul | 0.00 | 0.00 | 0.00 |
| Aug | 0.00 | 0.00 | 0.00 |
| Sep | 0.00 | 0.00 | 0.00 |
| Oct | 0.00 | 0.00 | 0.00 |
| Nov | 0.03 | 0.15 | 0.12 |
| Dec | 0.08 | 0.05 | -0.03 |
| ⌀ Month | 0.03 | 0.03 | -0.00 |