Climate Change Chart of Brandon, Canada
Comprehensive Climate Change Chart of Brandon, Canada: Monthly Averages and Impact Trends
Exploring the climate change data in Brandon, Canada reveals interesting insights into the changing weather patterns over the years.
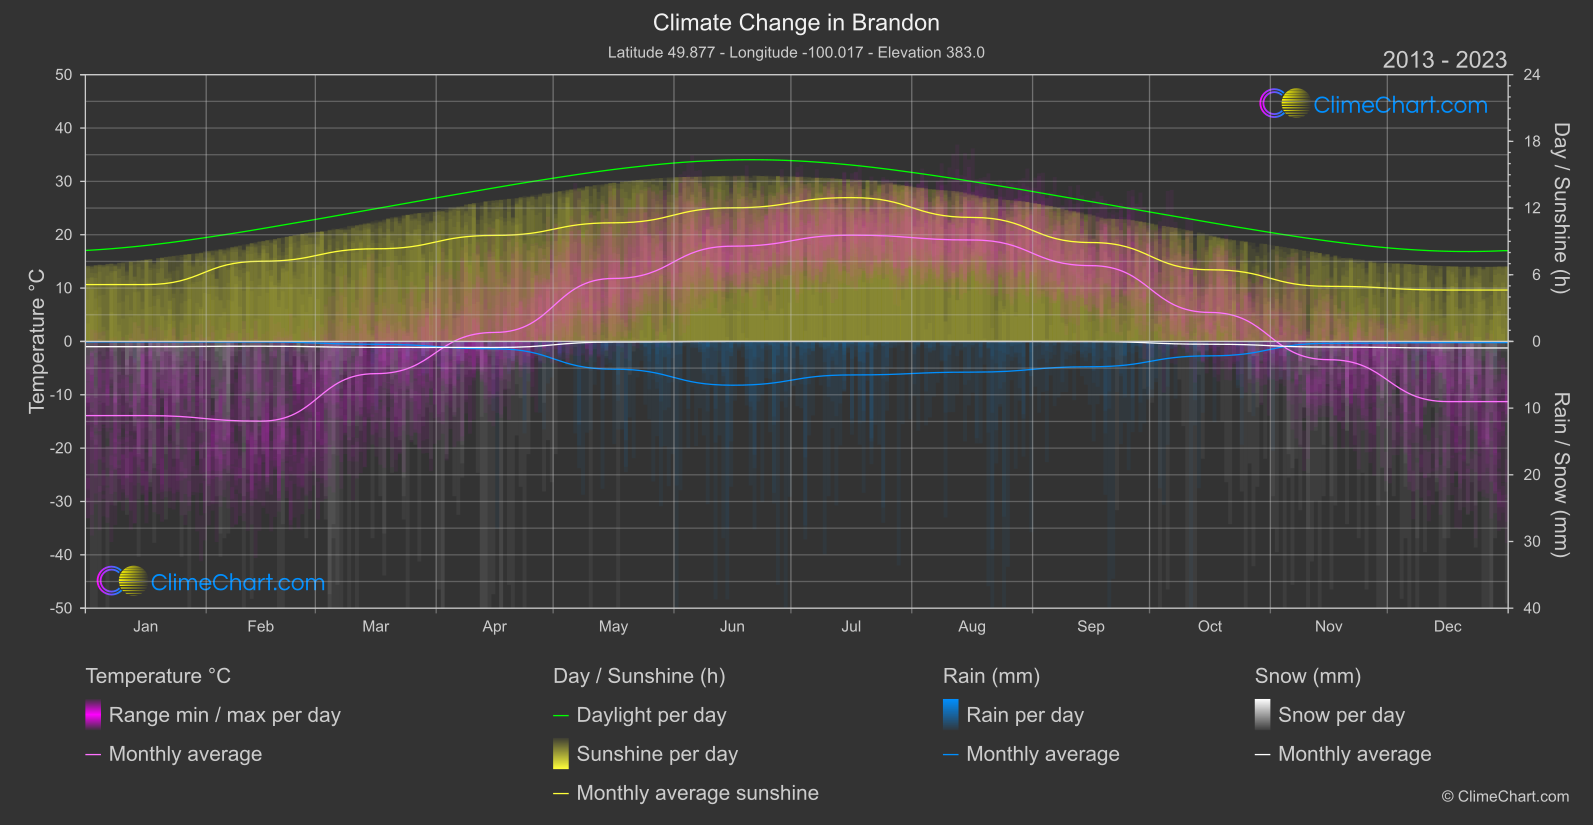
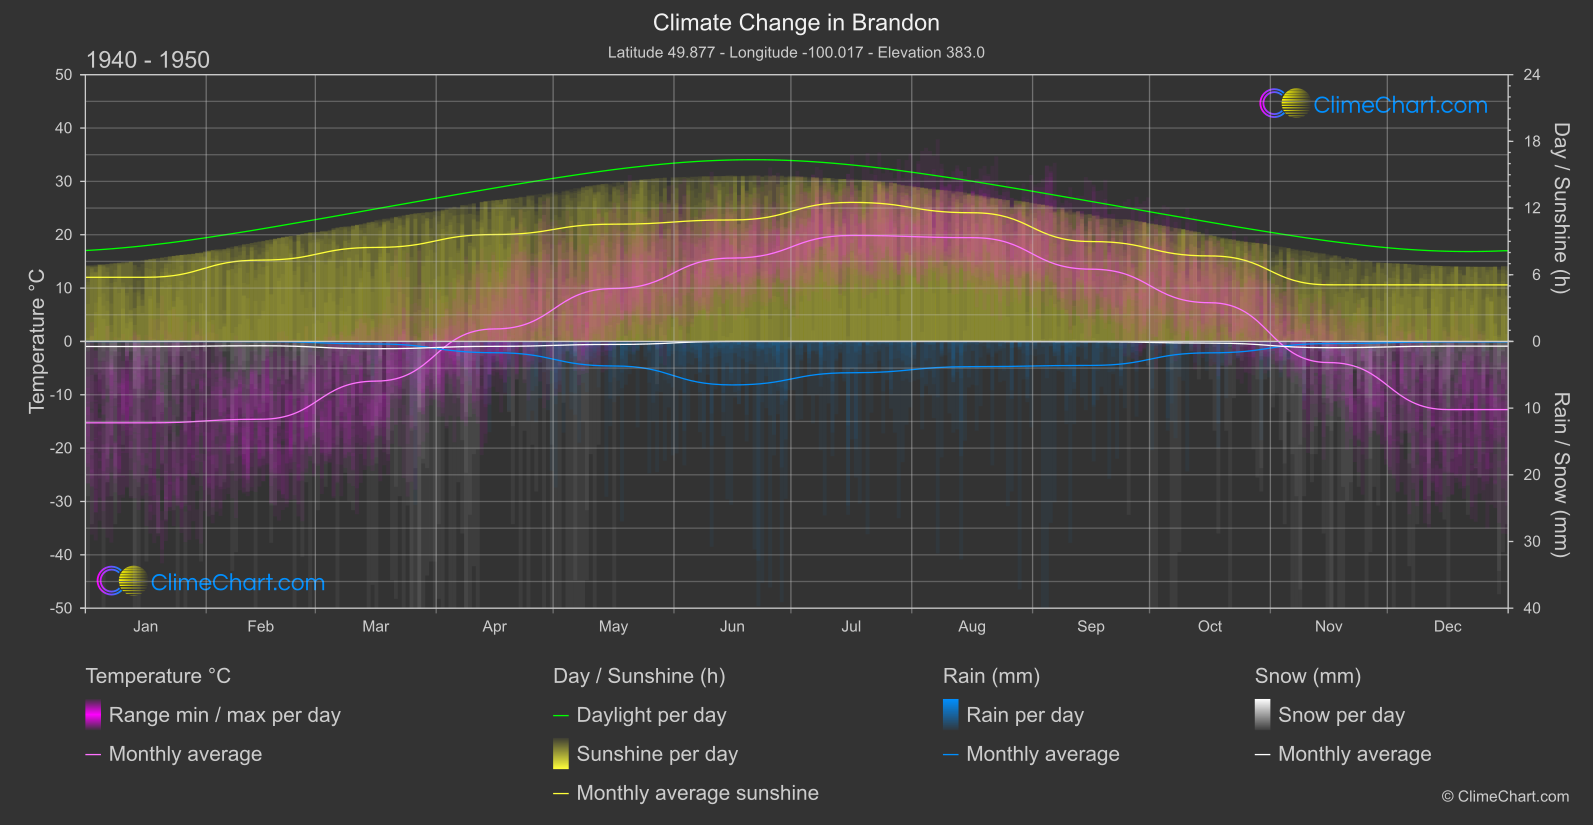
Brandon, Canada experiences varying temperatures and rainfall patterns throughout the year. From the data analysis, it is evident that June has the highest temperature change of 2.23°C, while October shows the highest decrease in temperature by 1.82°C. In terms of rainfall, August experiences the highest increase in mm with 0.41 mm change, whereas October has the largest increase in snowfall at 0.08 mm. Sunshine duration sees a significant increase in June with a change of 1.09 hours, while October experiences the most significant decrease in sunshine hours by 1.24 hours.
Climate Change Data Overview for Brandon, Canada
Explore the comprehensive climate change data for Brandon, Canada. This detailed table provides valuable insights into temperature variations, precipitation levels, and seasonal changes influenced by climate change, helping you understand the unique weather patterns of this region.
Temperature °C
| Month | ⌀ 1940 - 1950 | ⌀ 2013 - 2023 | +/- |
|---|---|---|---|
| Jan | -15.26 | -13.90 | 1.36 |
| Feb | -14.59 | -14.95 | -0.36 |
| Mar | -7.44 | -6.04 | 1.40 |
| Apr | 2.34 | 1.69 | -0.66 |
| May | 9.92 | 11.81 | 1.89 |
| Jun | 15.63 | 17.85 | 2.23 |
| Jul | 19.86 | 19.92 | 0.05 |
| Aug | 19.45 | 19.01 | -0.44 |
| Sep | 13.55 | 14.21 | 0.66 |
| Oct | 7.26 | 5.44 | -1.82 |
| Nov | -3.96 | -3.42 | 0.54 |
| Dec | -12.78 | -11.28 | 1.50 |
| ⌀ Month | 2.83 | 3.36 | 0.53 |
Sunshine (h)
| Month | ⌀ 1940 - 1950 | ⌀ 2013 - 2023 | +/- |
|---|---|---|---|
| Jan | 5.77 | 5.12 | -0.65 |
| Feb | 7.32 | 7.21 | -0.11 |
| Mar | 8.46 | 8.33 | -0.12 |
| Apr | 9.62 | 9.54 | -0.08 |
| May | 10.55 | 10.67 | 0.12 |
| Jun | 10.93 | 12.02 | 1.09 |
| Jul | 12.51 | 12.94 | 0.43 |
| Aug | 11.58 | 11.16 | -0.42 |
| Sep | 8.99 | 8.90 | -0.09 |
| Oct | 7.69 | 6.45 | -1.24 |
| Nov | 5.09 | 4.96 | -0.14 |
| Dec | 5.09 | 4.62 | -0.46 |
| ⌀ Month | 8.63 | 8.49 | -0.14 |
Rain (mm)
| Month | ⌀ 1940 - 1950 | ⌀ 2013 - 2023 | +/- |
|---|---|---|---|
| Jan | 0.00 | 0.03 | 0.03 |
| Feb | 0.01 | 0.04 | 0.03 |
| Mar | 0.19 | 0.21 | 0.02 |
| Apr | 0.85 | 0.55 | -0.29 |
| May | 1.84 | 2.08 | 0.24 |
| Jun | 3.26 | 3.28 | 0.02 |
| Jul | 2.35 | 2.51 | 0.16 |
| Aug | 1.89 | 2.30 | 0.41 |
| Sep | 1.80 | 1.90 | 0.10 |
| Oct | 0.86 | 1.08 | 0.23 |
| Nov | 0.16 | 0.14 | -0.02 |
| Dec | 0.03 | 0.09 | 0.06 |
| ⌀ Month | 1.10 | 1.19 | 0.08 |
Snow (mm)
| Month | ⌀ 1940 - 1950 | ⌀ 2013 - 2023 | +/- |
|---|---|---|---|
| Jan | 0.38 | 0.39 | 0.01 |
| Feb | 0.33 | 0.36 | 0.03 |
| Mar | 0.55 | 0.44 | -0.10 |
| Apr | 0.37 | 0.45 | 0.09 |
| May | 0.22 | 0.05 | -0.18 |
| Jun | 0.00 | 0.00 | 0.00 |
| Jul | 0.00 | 0.00 | 0.00 |
| Aug | 0.00 | 0.00 | 0.00 |
| Sep | 0.02 | 0.01 | -0.01 |
| Oct | 0.13 | 0.21 | 0.08 |
| Nov | 0.47 | 0.42 | -0.05 |
| Dec | 0.35 | 0.49 | 0.14 |
| ⌀ Month | 0.23 | 0.24 | 0.00 |