Climate Change Chart of Iqaluit, Canada
Comprehensive Climate Change Chart of Iqaluit, Canada: Monthly Averages and Impact Trends
Explore the climate change data for Iqaluit, Canada, showcasing the temperature, rainfall, snowfall, and sunshine duration trends over the years.
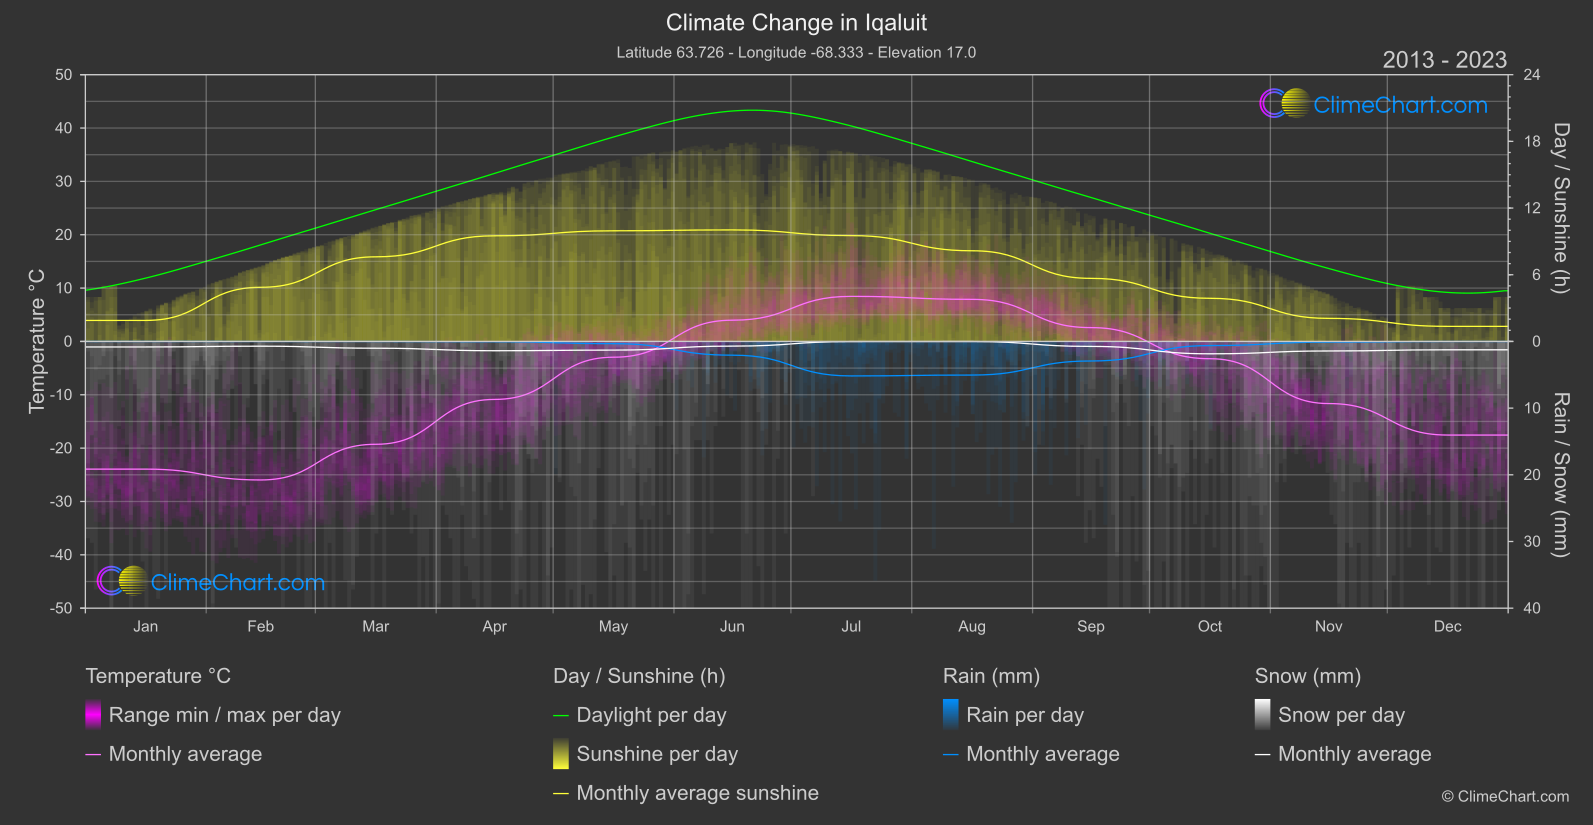
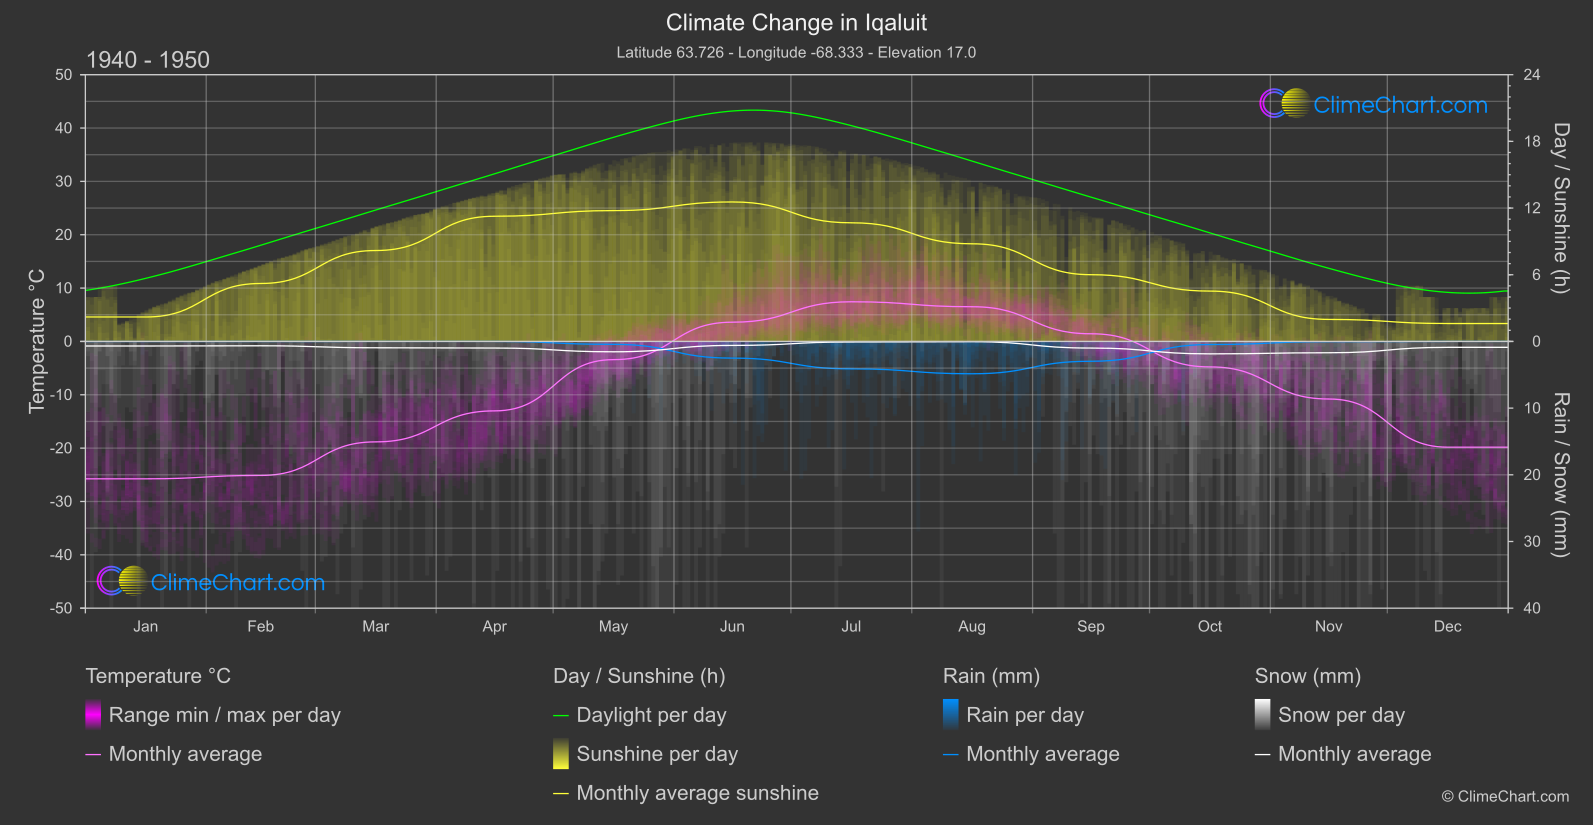
Iqaluit, the capital of Nunavut, experiences a notable climate change with increasing temperatures and shifting precipitation patterns. Analyzing the data, we find that the month of April shows the highest temperature change of 2.15°C between 1940-1950 and 2013-2024. Additionally, July exhibits the most significant increase in rainfall with a change of 0.53 mm. Snowfall in December has notably increased by 0.18 mm, while sunshine duration has decreased across all months, with the most significant change observed in June at -2.51 hours.
Climate Change Data Overview for Iqaluit, Canada
Explore the comprehensive climate change data for Iqaluit, Canada. This detailed table provides valuable insights into temperature variations, precipitation levels, and seasonal changes influenced by climate change, helping you understand the unique weather patterns of this region.
Temperature °C
| Month | ⌀ 1940 - 1950 | ⌀ 2013 - 2023 | +/- |
|---|---|---|---|
| Jan | -25.76 | -23.94 | 1.82 |
| Feb | -25.12 | -25.97 | -0.85 |
| Mar | -18.83 | -19.28 | -0.45 |
| Apr | -13.02 | -10.87 | 2.15 |
| May | -3.41 | -2.96 | 0.46 |
| Jun | 3.61 | 3.98 | 0.37 |
| Jul | 7.43 | 8.45 | 1.01 |
| Aug | 6.50 | 7.89 | 1.38 |
| Sep | 1.44 | 2.59 | 1.15 |
| Oct | -4.78 | -3.24 | 1.54 |
| Nov | -10.79 | -11.65 | -0.85 |
| Dec | -19.82 | -17.55 | 2.27 |
| ⌀ Month | -8.54 | -7.71 | 0.83 |
Sunshine (h)
| Month | ⌀ 1940 - 1950 | ⌀ 2013 - 2023 | +/- |
|---|---|---|---|
| Jan | 2.20 | 1.89 | -0.31 |
| Feb | 5.21 | 4.87 | -0.34 |
| Mar | 8.18 | 7.61 | -0.57 |
| Apr | 11.26 | 9.50 | -1.76 |
| May | 11.77 | 9.95 | -1.82 |
| Jun | 12.55 | 10.03 | -2.51 |
| Jul | 10.67 | 9.52 | -1.15 |
| Aug | 8.78 | 8.16 | -0.63 |
| Sep | 6.00 | 5.68 | -0.33 |
| Oct | 4.53 | 3.88 | -0.65 |
| Nov | 1.98 | 2.07 | 0.09 |
| Dec | 1.61 | 1.36 | -0.26 |
| ⌀ Month | 7.06 | 6.21 | -0.85 |
Rain (mm)
| Month | ⌀ 1940 - 1950 | ⌀ 2013 - 2023 | +/- |
|---|---|---|---|
| Jan | 0.01 | 0.00 | -0.00 |
| Feb | 0.00 | 0.00 | 0.00 |
| Mar | 0.00 | 0.00 | 0.00 |
| Apr | 0.00 | 0.02 | 0.02 |
| May | 0.22 | 0.17 | -0.05 |
| Jun | 1.25 | 1.03 | -0.22 |
| Jul | 2.06 | 2.59 | 0.53 |
| Aug | 2.42 | 2.52 | 0.10 |
| Sep | 1.49 | 1.47 | -0.02 |
| Oct | 0.23 | 0.31 | 0.08 |
| Nov | 0.02 | 0.05 | 0.04 |
| Dec | 0.00 | 0.00 | 0.00 |
| ⌀ Month | 0.64 | 0.68 | 0.04 |
Snow (mm)
| Month | ⌀ 1940 - 1950 | ⌀ 2013 - 2023 | +/- |
|---|---|---|---|
| Jan | 0.34 | 0.41 | 0.07 |
| Feb | 0.33 | 0.36 | 0.03 |
| Mar | 0.48 | 0.51 | 0.03 |
| Apr | 0.50 | 0.70 | 0.20 |
| May | 0.78 | 0.65 | -0.13 |
| Jun | 0.30 | 0.35 | 0.05 |
| Jul | 0.04 | 0.01 | -0.03 |
| Aug | 0.02 | 0.01 | -0.01 |
| Sep | 0.50 | 0.37 | -0.12 |
| Oct | 0.93 | 0.93 | -0.00 |
| Nov | 0.85 | 0.72 | -0.13 |
| Dec | 0.44 | 0.63 | 0.18 |
| ⌀ Month | 0.46 | 0.47 | 0.01 |