Climate Change Chart of Winnipeg, Canada
Comprehensive Climate Change Chart of Winnipeg, Canada: Monthly Averages and Impact Trends
Explore the changing climate in Winnipeg, Canada, through detailed data analysis and insights. Discover how temperatures, rainfall, snowfall, and sunshine duration have evolved over decades.
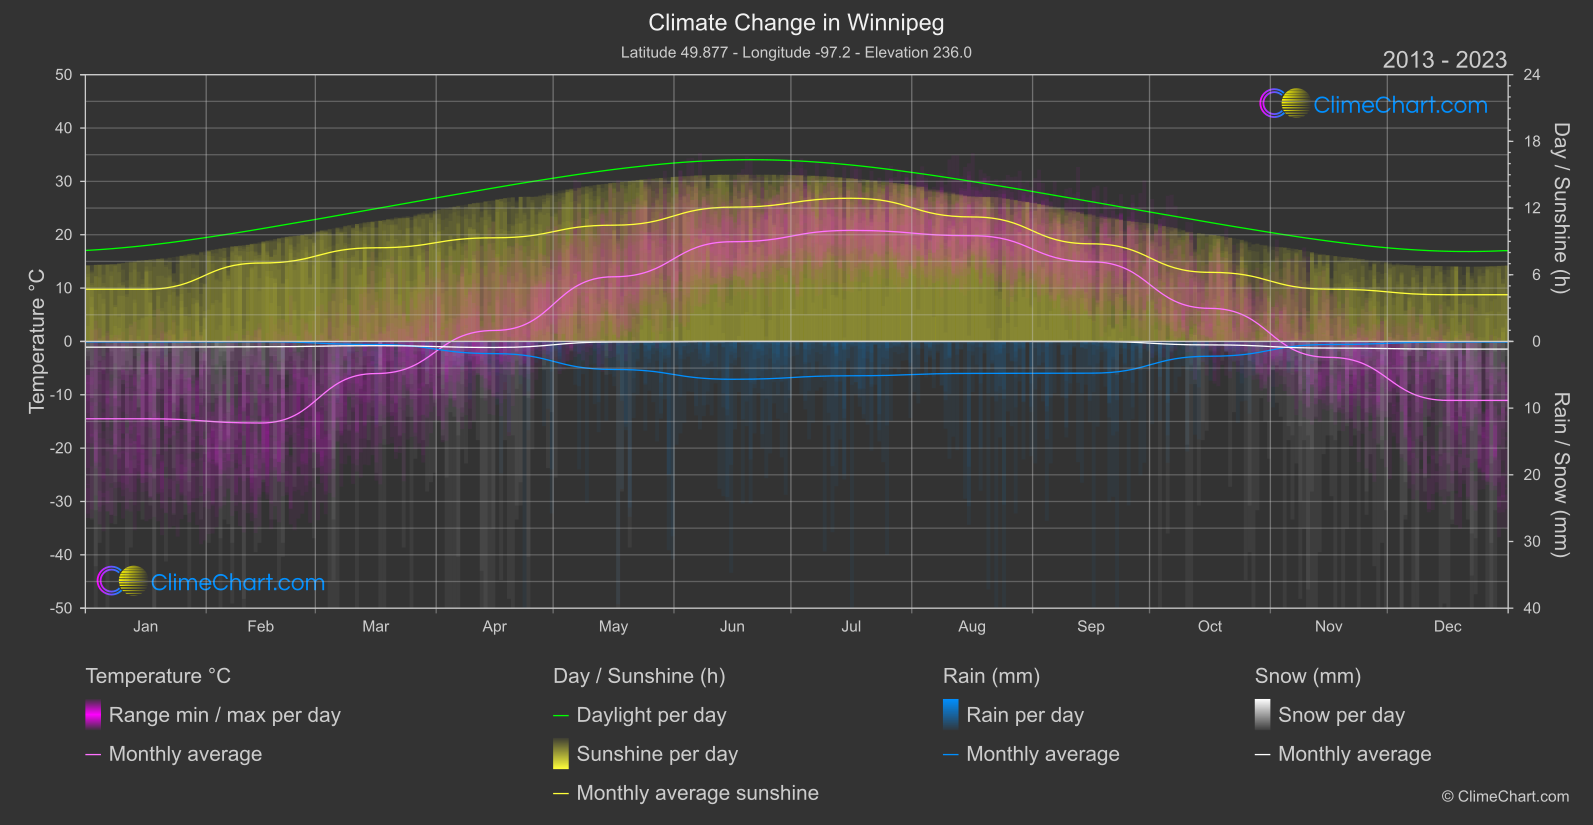
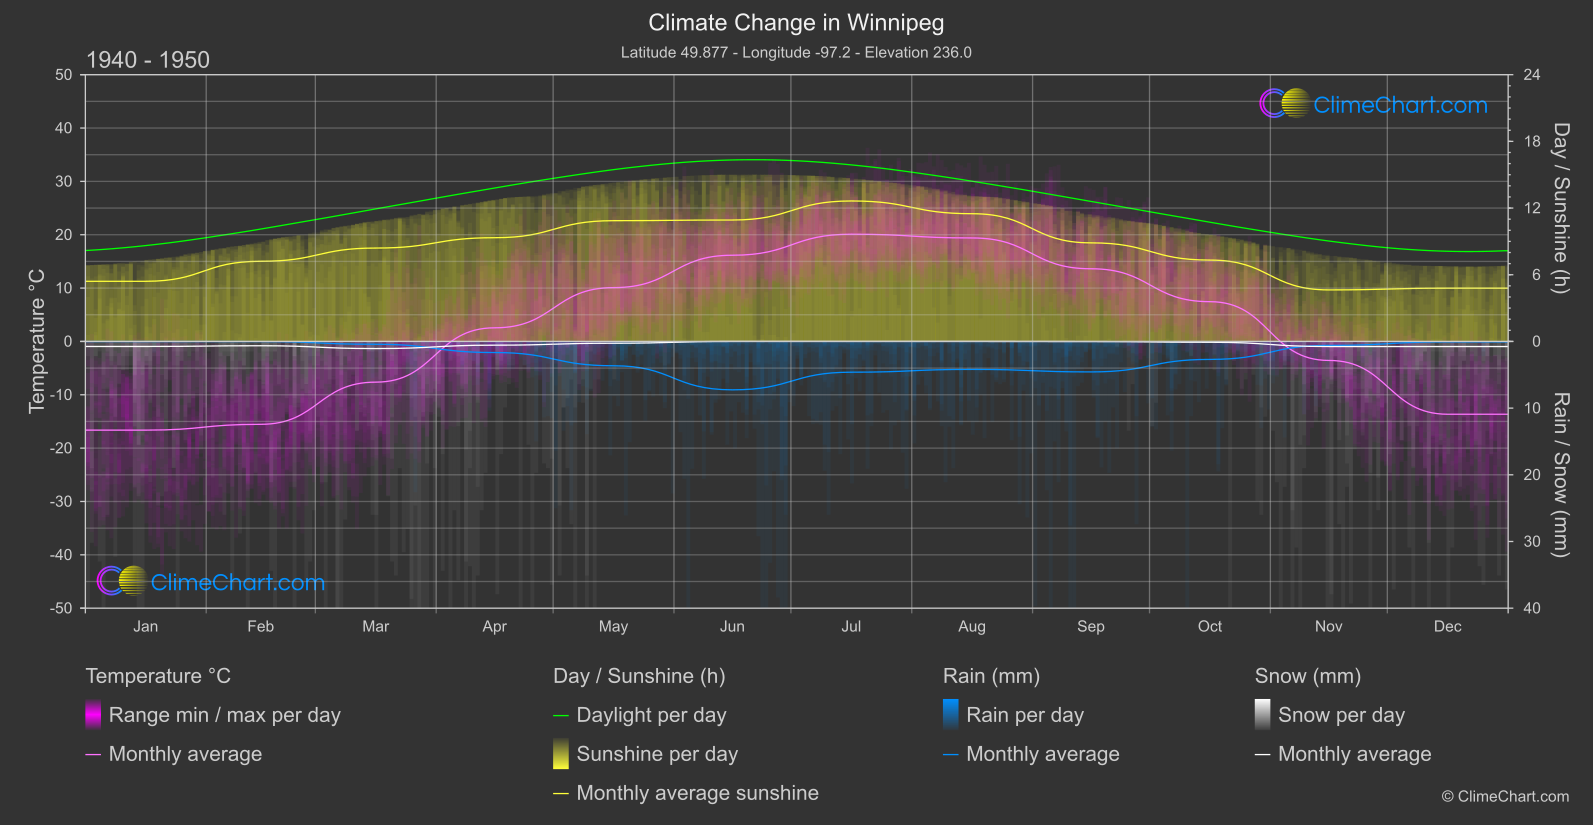
Winnipeg, located in Canada, has seen noticeable shifts in its climate patterns over the years. From the data comparison between the years 1940-1950 and 2013-2024, it is evident that the month of May experienced the highest increase in temperature, with a significant change of 2.03°C. On the other hand, October observed the most substantial decrease in temperature, with a change of -1.25°C. In terms of rainfall, May also had the largest increase, with a rise of 0.28mm, while October saw the most significant decrease in rainfall, with a decline of 0.24mm. The snowfall data showed varied changes across the months, with notable increases in snowfall observed in October and December. Sunshine duration also displayed fluctuations, with June experiencing the highest increase in sunshine hours and October having the most significant decrease.
Climate Change Data Overview for Winnipeg, Canada
Explore the comprehensive climate change data for Winnipeg, Canada. This detailed table provides valuable insights into temperature variations, precipitation levels, and seasonal changes influenced by climate change, helping you understand the unique weather patterns of this region.
Temperature °C
| Month | ⌀ 1940 - 1950 | ⌀ 2013 - 2023 | +/- |
|---|---|---|---|
| Jan | -16.63 | -14.50 | 2.13 |
| Feb | -15.53 | -15.29 | 0.24 |
| Mar | -7.63 | -6.02 | 1.61 |
| Apr | 2.55 | 2.06 | -0.49 |
| May | 10.09 | 12.12 | 2.03 |
| Jun | 16.16 | 18.69 | 2.53 |
| Jul | 20.10 | 20.81 | 0.71 |
| Aug | 19.40 | 19.82 | 0.42 |
| Sep | 13.62 | 14.94 | 1.32 |
| Oct | 7.45 | 6.20 | -1.25 |
| Nov | -3.56 | -2.98 | 0.59 |
| Dec | -13.65 | -11.05 | 2.59 |
| ⌀ Month | 2.70 | 3.73 | 1.04 |
Sunshine (h)
| Month | ⌀ 1940 - 1950 | ⌀ 2013 - 2023 | +/- |
|---|---|---|---|
| Jan | 5.41 | 4.70 | -0.71 |
| Feb | 7.21 | 7.05 | -0.16 |
| Mar | 8.40 | 8.43 | 0.03 |
| Apr | 9.33 | 9.33 | -0.01 |
| May | 10.86 | 10.46 | -0.41 |
| Jun | 10.92 | 12.08 | 1.16 |
| Jul | 12.64 | 12.88 | 0.24 |
| Aug | 11.49 | 11.20 | -0.29 |
| Sep | 8.87 | 8.78 | -0.09 |
| Oct | 7.32 | 6.22 | -1.10 |
| Nov | 4.64 | 4.71 | 0.07 |
| Dec | 4.79 | 4.20 | -0.59 |
| ⌀ Month | 8.49 | 8.34 | -0.16 |
Rain (mm)
| Month | ⌀ 1940 - 1950 | ⌀ 2013 - 2023 | +/- |
|---|---|---|---|
| Jan | 0.01 | 0.04 | 0.03 |
| Feb | 0.01 | 0.02 | 0.01 |
| Mar | 0.21 | 0.23 | 0.02 |
| Apr | 0.83 | 0.91 | 0.08 |
| May | 1.82 | 2.10 | 0.28 |
| Jun | 3.63 | 2.84 | -0.79 |
| Jul | 2.31 | 2.57 | 0.27 |
| Aug | 2.10 | 2.40 | 0.30 |
| Sep | 2.29 | 2.38 | 0.09 |
| Oct | 1.35 | 1.11 | -0.24 |
| Nov | 0.30 | 0.23 | -0.07 |
| Dec | 0.03 | 0.05 | 0.01 |
| ⌀ Month | 1.24 | 1.24 | -0.00 |
Snow (mm)
| Month | ⌀ 1940 - 1950 | ⌀ 2013 - 2023 | +/- |
|---|---|---|---|
| Jan | 0.38 | 0.43 | 0.05 |
| Feb | 0.32 | 0.40 | 0.08 |
| Mar | 0.53 | 0.32 | -0.22 |
| Apr | 0.28 | 0.45 | 0.17 |
| May | 0.13 | 0.04 | -0.09 |
| Jun | 0.00 | 0.00 | 0.00 |
| Jul | 0.00 | 0.00 | 0.00 |
| Aug | 0.00 | 0.00 | 0.00 |
| Sep | 0.01 | 0.00 | -0.01 |
| Oct | 0.06 | 0.26 | 0.20 |
| Nov | 0.38 | 0.50 | 0.12 |
| Dec | 0.38 | 0.57 | 0.19 |
| ⌀ Month | 0.21 | 0.25 | 0.04 |