Climate Change Chart of Dubai, United Arab Emirates
Comprehensive Climate Change Chart of Dubai, United Arab Emirates: Monthly Averages and Impact Trends
Explore the changing climate in Dubai, United Arab Emirates, from 1940 to 1950 compared to 2013 to 2024, with insights on temperature, rainfall, and sunshine duration.
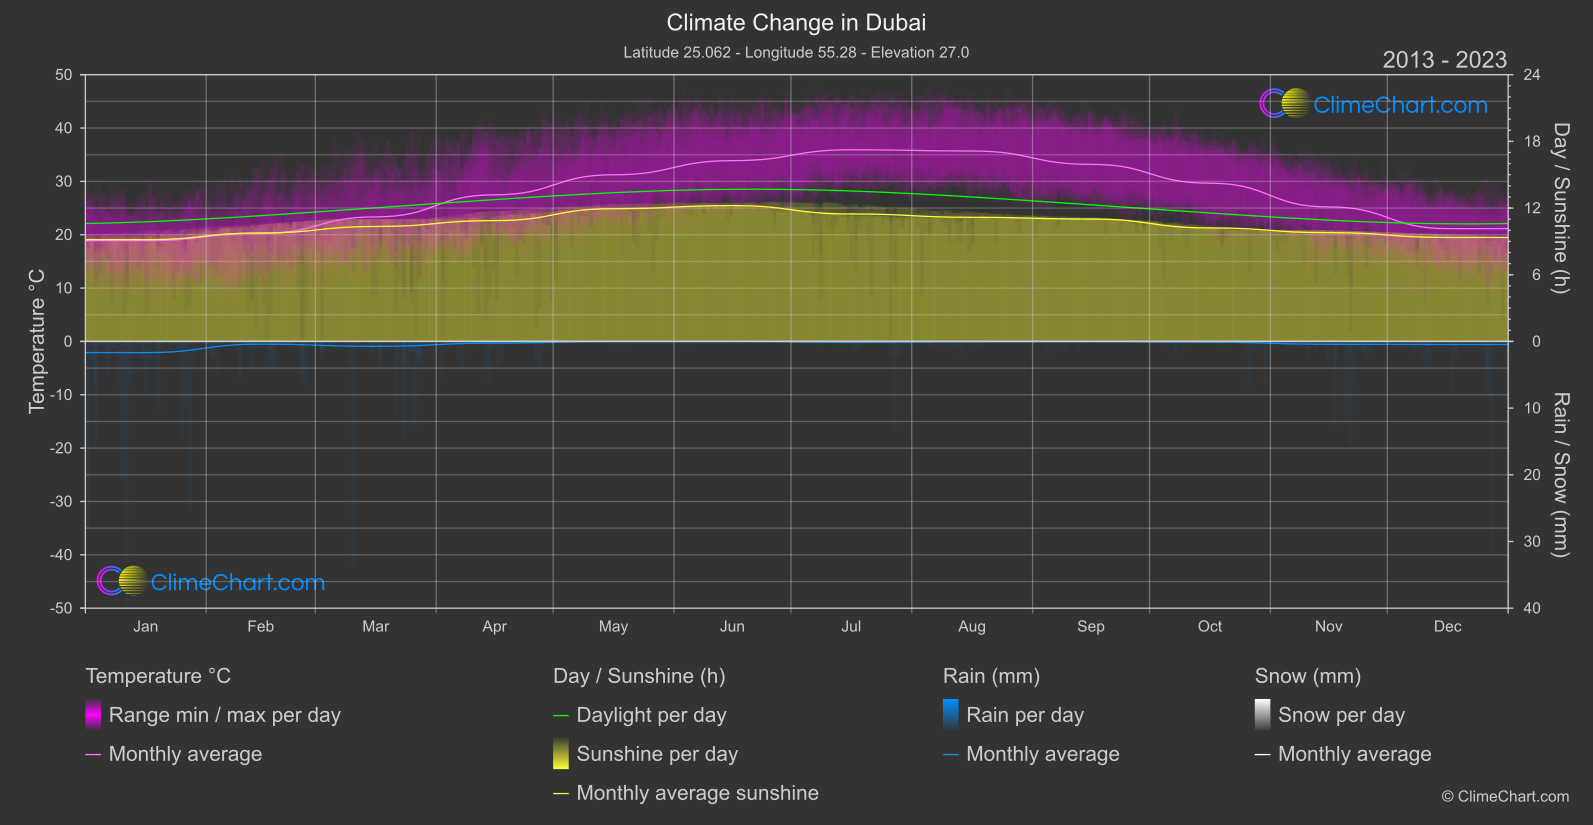
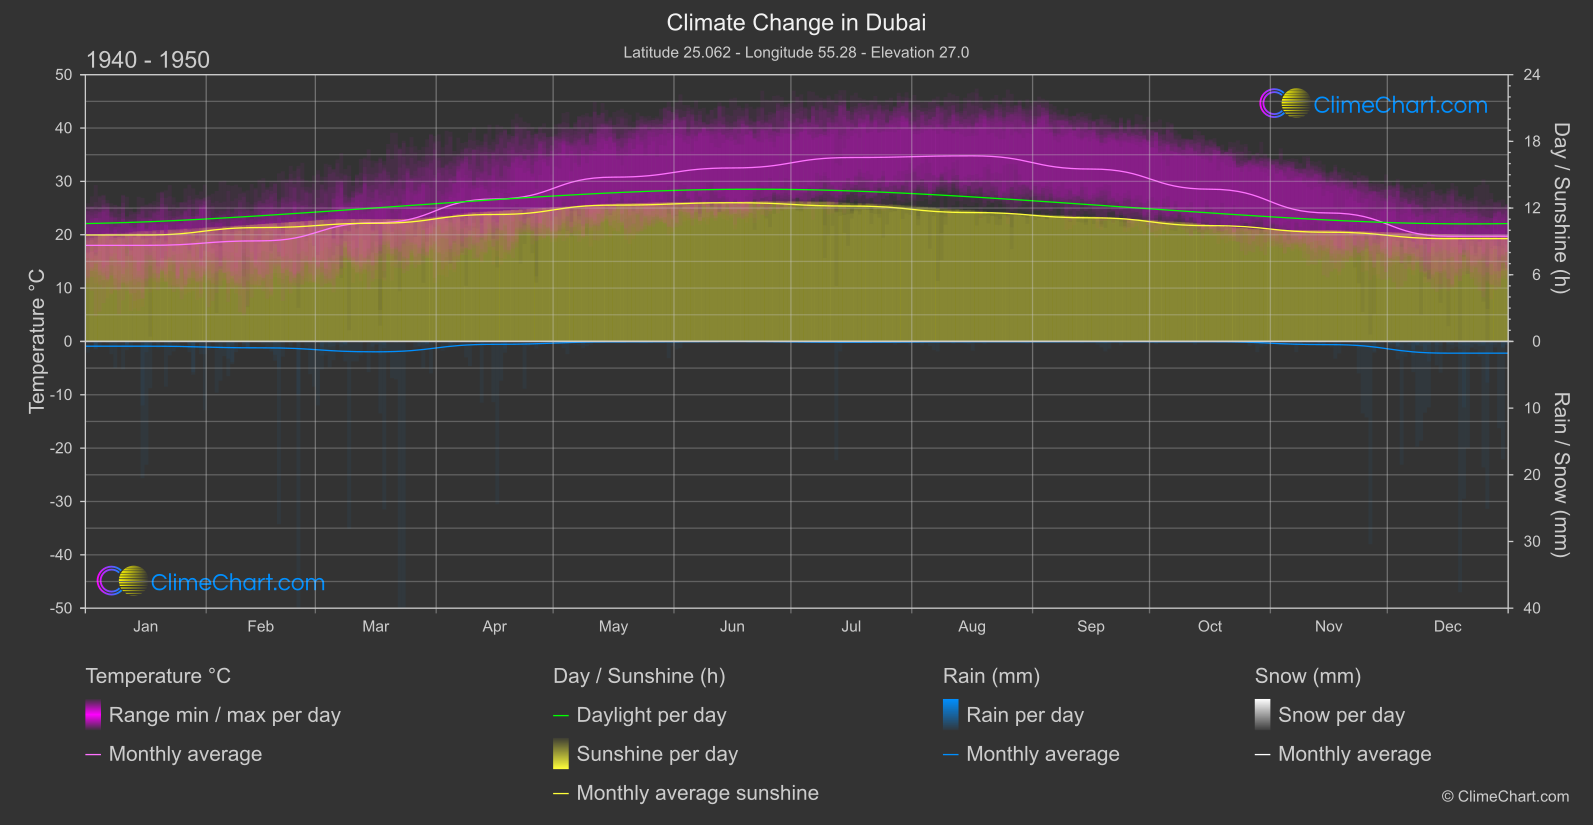
Dubai, United Arab Emirates, has experienced notable changes in climate over the years. Analyzing the data from 1940 to 1950 compared to 2013 to 2024, it is evident that there has been an increase in temperature across various months. For instance, in June, the temperature has risen by 1.37°C. On the other hand, the rainfall pattern has shown fluctuations, with some months experiencing a decrease in rainfall compared to the past. Additionally, the sunshine duration has seen variations, with certain months having reduced sunshine hours. Understanding these changes is crucial for climate monitoring and adaptation strategies in Dubai.
Climate Change Data Overview for Dubai, United Arab Emirates
Explore the comprehensive climate change data for Dubai, United Arab Emirates. This detailed table provides valuable insights into temperature variations, precipitation levels, and seasonal changes influenced by climate change, helping you understand the unique weather patterns of this region.
Temperature °C
| Month | ⌀ 1940 - 1950 | ⌀ 2013 - 2023 | +/- |
|---|---|---|---|
| Jan | 18.00 | 18.89 | 0.89 |
| Feb | 18.85 | 20.24 | 1.39 |
| Mar | 22.24 | 23.34 | 1.11 |
| Apr | 26.70 | 27.48 | 0.79 |
| May | 30.79 | 31.24 | 0.45 |
| Jun | 32.52 | 33.89 | 1.37 |
| Jul | 34.47 | 35.93 | 1.45 |
| Aug | 34.79 | 35.69 | 0.90 |
| Sep | 32.31 | 33.20 | 0.88 |
| Oct | 28.53 | 29.66 | 1.13 |
| Nov | 24.08 | 25.21 | 1.13 |
| Dec | 19.72 | 21.14 | 1.42 |
| ⌀ Month | 26.92 | 27.99 | 1.07 |
Sunshine (h)
| Month | ⌀ 1940 - 1950 | ⌀ 2013 - 2023 | +/- |
|---|---|---|---|
| Jan | 9.58 | 9.16 | -0.42 |
| Feb | 10.25 | 9.76 | -0.49 |
| Mar | 10.63 | 10.34 | -0.29 |
| Apr | 11.42 | 10.87 | -0.55 |
| May | 12.26 | 11.94 | -0.32 |
| Jun | 12.48 | 12.22 | -0.26 |
| Jul | 12.18 | 11.47 | -0.71 |
| Aug | 11.59 | 11.17 | -0.42 |
| Sep | 11.12 | 11.01 | -0.11 |
| Oct | 10.42 | 10.21 | -0.20 |
| Nov | 9.83 | 9.79 | -0.04 |
| Dec | 9.25 | 9.35 | 0.11 |
| ⌀ Month | 10.92 | 10.61 | -0.31 |
Rain (mm)
| Month | ⌀ 1940 - 1950 | ⌀ 2013 - 2023 | +/- |
|---|---|---|---|
| Jan | 0.36 | 0.84 | 0.48 |
| Feb | 0.48 | 0.20 | -0.28 |
| Mar | 0.78 | 0.37 | -0.41 |
| Apr | 0.22 | 0.13 | -0.09 |
| May | 0.03 | 0.01 | -0.03 |
| Jun | 0.00 | 0.00 | -0.00 |
| Jul | 0.06 | 0.07 | 0.01 |
| Aug | 0.02 | 0.03 | 0.01 |
| Sep | 0.01 | 0.02 | 0.00 |
| Oct | 0.02 | 0.06 | 0.04 |
| Nov | 0.24 | 0.21 | -0.03 |
| Dec | 0.88 | 0.23 | -0.65 |
| ⌀ Month | 0.26 | 0.18 | -0.08 |
Snow (mm)
| Month | ⌀ 1940 - 1950 | ⌀ 2013 - 2023 | +/- |
|---|---|---|---|
| Jan | 0.00 | 0.00 | 0.00 |
| Feb | 0.00 | 0.00 | 0.00 |
| Mar | 0.00 | 0.00 | 0.00 |
| Apr | 0.00 | 0.00 | 0.00 |
| May | 0.00 | 0.00 | 0.00 |
| Jun | 0.00 | 0.00 | 0.00 |
| Jul | 0.00 | 0.00 | 0.00 |
| Aug | 0.00 | 0.00 | 0.00 |
| Sep | 0.00 | 0.00 | 0.00 |
| Oct | 0.00 | 0.00 | 0.00 |
| Nov | 0.00 | 0.00 | 0.00 |
| Dec | 0.00 | 0.00 | 0.00 |
| ⌀ Month | 0.00 | 0.00 | 0.00 |