Climate Change Chart of Edmonton, Canada
Comprehensive Climate Change Chart of Edmonton, Canada: Monthly Averages and Impact Trends
Exploring the changing climate of Edmonton, Canada
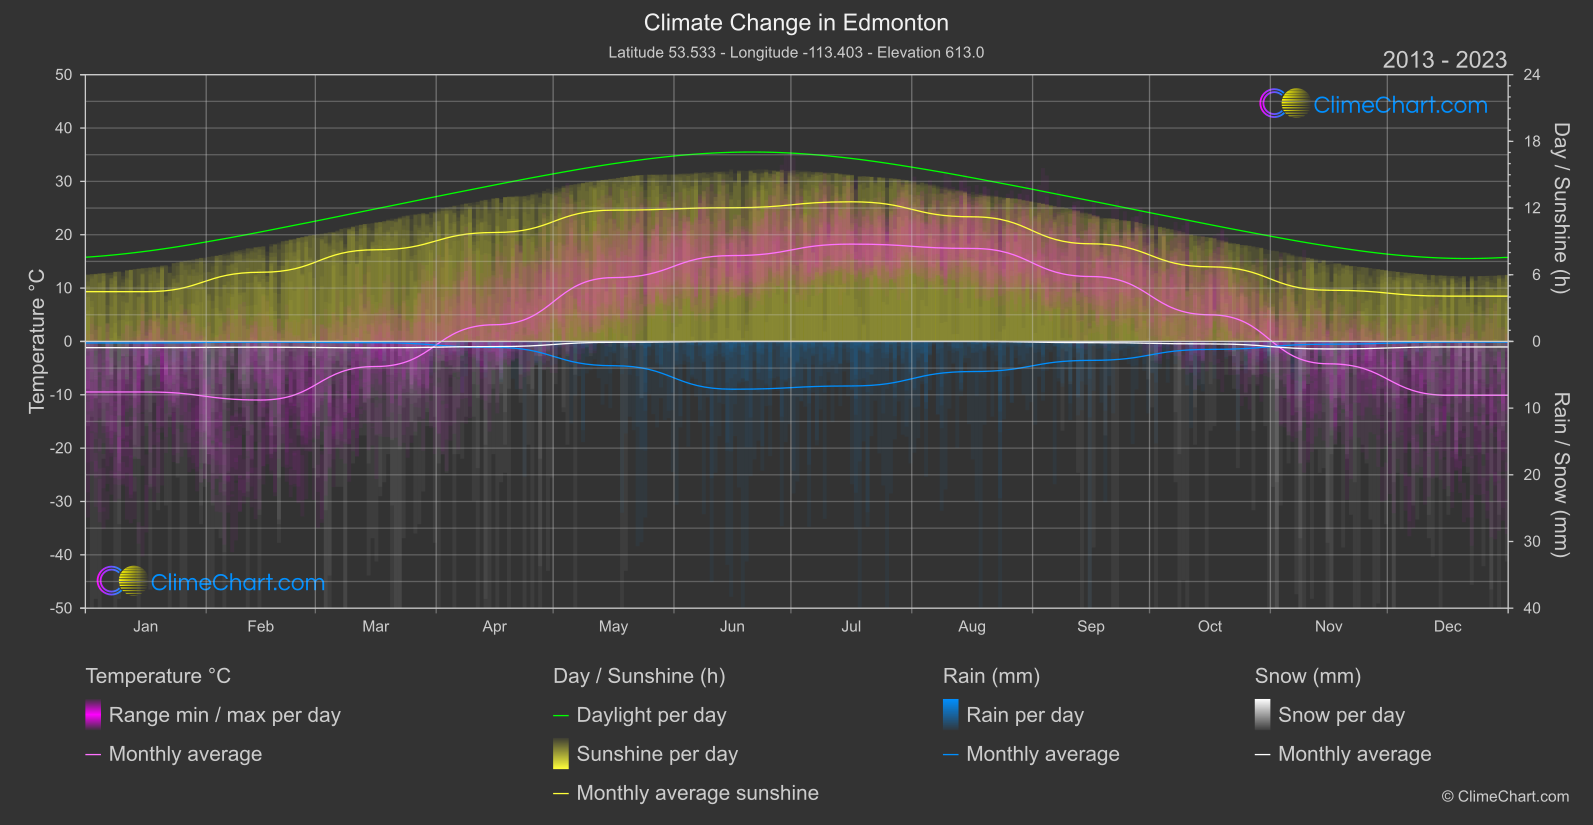
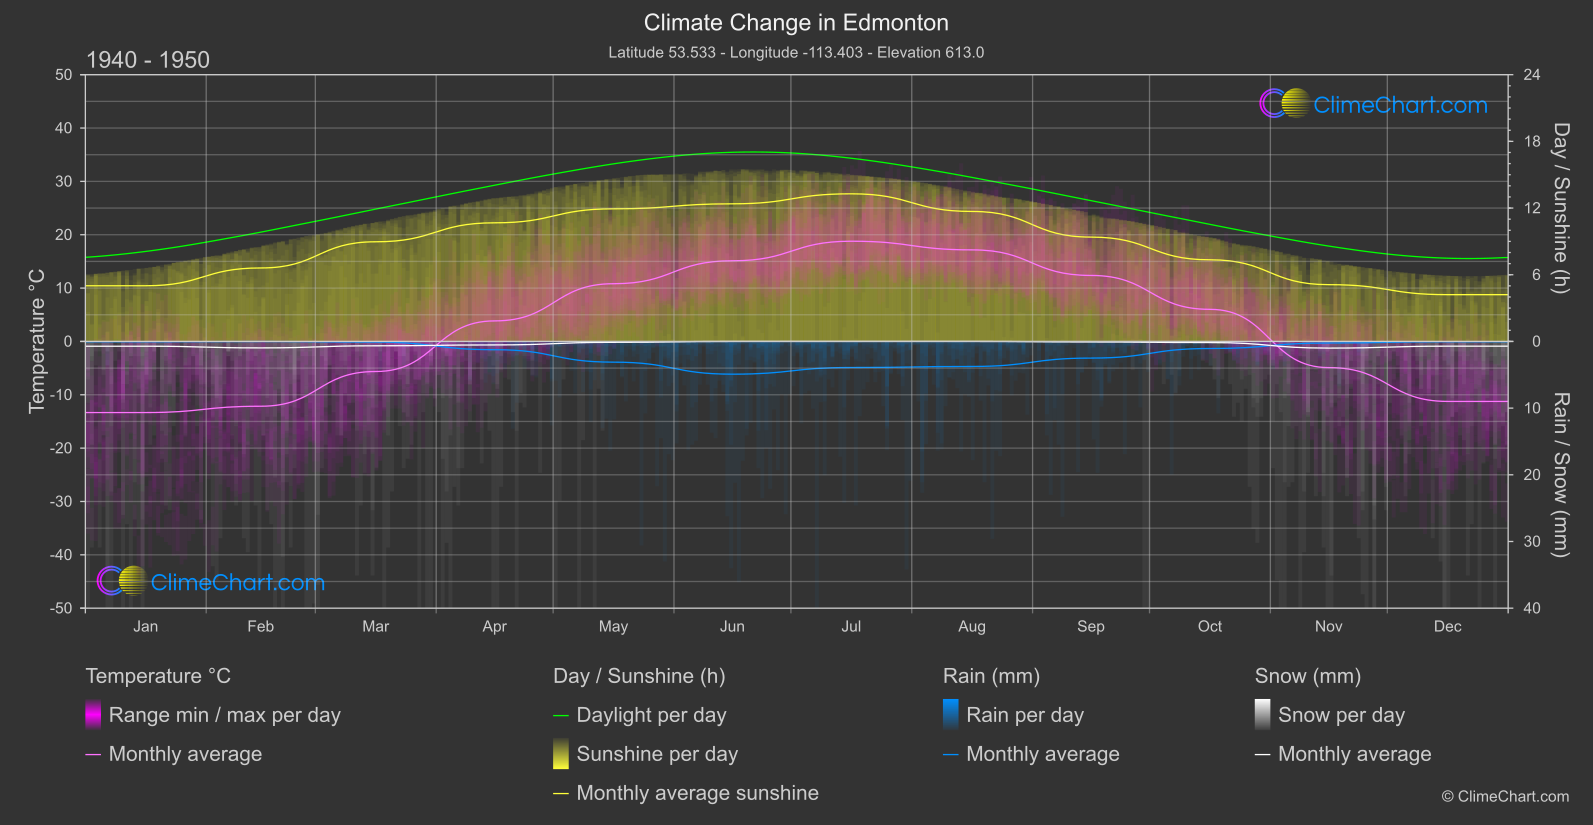
Edmonton, Canada, experiences variations in temperature, rainfall, snowfall, and sunshine duration over the years. Analyzing data from 1940 to 1950 and comparing it with 2013 to 2024 reveals interesting insights. For instance, May sees an increase in temperature by 1.14°C and a rise in rainfall by 0.27 mm. On the other hand, October witnesses a temperature drop of 1.02°C and a slight increase in rainfall by 0.07 mm. These fluctuations offer valuable information about the evolving climate patterns in Edmonton.
Climate Change Data Overview for Edmonton, Canada
Explore the comprehensive climate change data for Edmonton, Canada. This detailed table provides valuable insights into temperature variations, precipitation levels, and seasonal changes influenced by climate change, helping you understand the unique weather patterns of this region.
Temperature °C
| Month | ⌀ 1940 - 1950 | ⌀ 2013 - 2023 | +/- |
|---|---|---|---|
| Jan | -13.33 | -9.47 | 3.86 |
| Feb | -12.15 | -10.98 | 1.17 |
| Mar | -5.64 | -4.70 | 0.94 |
| Apr | 3.85 | 3.13 | -0.72 |
| May | 10.82 | 11.96 | 1.14 |
| Jun | 15.12 | 16.09 | 0.98 |
| Jul | 18.78 | 18.24 | -0.54 |
| Aug | 17.16 | 17.43 | 0.27 |
| Sep | 12.37 | 12.17 | -0.20 |
| Oct | 6.01 | 4.99 | -1.02 |
| Nov | -4.91 | -4.20 | 0.71 |
| Dec | -11.24 | -10.09 | 1.15 |
| ⌀ Month | 3.07 | 3.71 | 0.64 |
Sunshine (h)
| Month | ⌀ 1940 - 1950 | ⌀ 2013 - 2023 | +/- |
|---|---|---|---|
| Jan | 5.01 | 4.48 | -0.53 |
| Feb | 6.61 | 6.22 | -0.39 |
| Mar | 8.97 | 8.25 | -0.72 |
| Apr | 10.67 | 9.80 | -0.87 |
| May | 11.93 | 11.81 | -0.12 |
| Jun | 12.38 | 12.03 | -0.35 |
| Jul | 13.28 | 12.56 | -0.72 |
| Aug | 11.70 | 11.21 | -0.48 |
| Sep | 9.39 | 8.79 | -0.60 |
| Oct | 7.35 | 6.71 | -0.63 |
| Nov | 5.11 | 4.61 | -0.50 |
| Dec | 4.21 | 4.08 | -0.13 |
| ⌀ Month | 8.88 | 8.38 | -0.50 |
Rain (mm)
| Month | ⌀ 1940 - 1950 | ⌀ 2013 - 2023 | +/- |
|---|---|---|---|
| Jan | 0.03 | 0.11 | 0.09 |
| Feb | 0.01 | 0.05 | 0.05 |
| Mar | 0.05 | 0.10 | 0.05 |
| Apr | 0.62 | 0.45 | -0.17 |
| May | 1.55 | 1.82 | 0.27 |
| Jun | 2.46 | 3.58 | 1.13 |
| Jul | 1.95 | 3.34 | 1.38 |
| Aug | 1.88 | 2.26 | 0.38 |
| Sep | 1.25 | 1.42 | 0.17 |
| Oct | 0.53 | 0.60 | 0.07 |
| Nov | 0.12 | 0.21 | 0.09 |
| Dec | 0.02 | 0.05 | 0.03 |
| ⌀ Month | 0.87 | 1.17 | 0.29 |
Snow (mm)
| Month | ⌀ 1940 - 1950 | ⌀ 2013 - 2023 | +/- |
|---|---|---|---|
| Jan | 0.36 | 0.47 | 0.11 |
| Feb | 0.48 | 0.43 | -0.05 |
| Mar | 0.33 | 0.48 | 0.15 |
| Apr | 0.26 | 0.39 | 0.12 |
| May | 0.07 | 0.07 | -0.00 |
| Jun | 0.00 | 0.00 | 0.00 |
| Jul | 0.00 | 0.00 | 0.00 |
| Aug | 0.00 | 0.00 | 0.00 |
| Sep | 0.04 | 0.09 | 0.05 |
| Oct | 0.08 | 0.19 | 0.10 |
| Nov | 0.50 | 0.56 | 0.06 |
| Dec | 0.35 | 0.41 | 0.06 |
| ⌀ Month | 0.21 | 0.26 | 0.05 |