Climate Change Chart of Moncton, Canada
Comprehensive Climate Change Chart of Moncton, Canada: Monthly Averages and Impact Trends
Explore the changing climate in Moncton, Canada, through insightful data analysis.
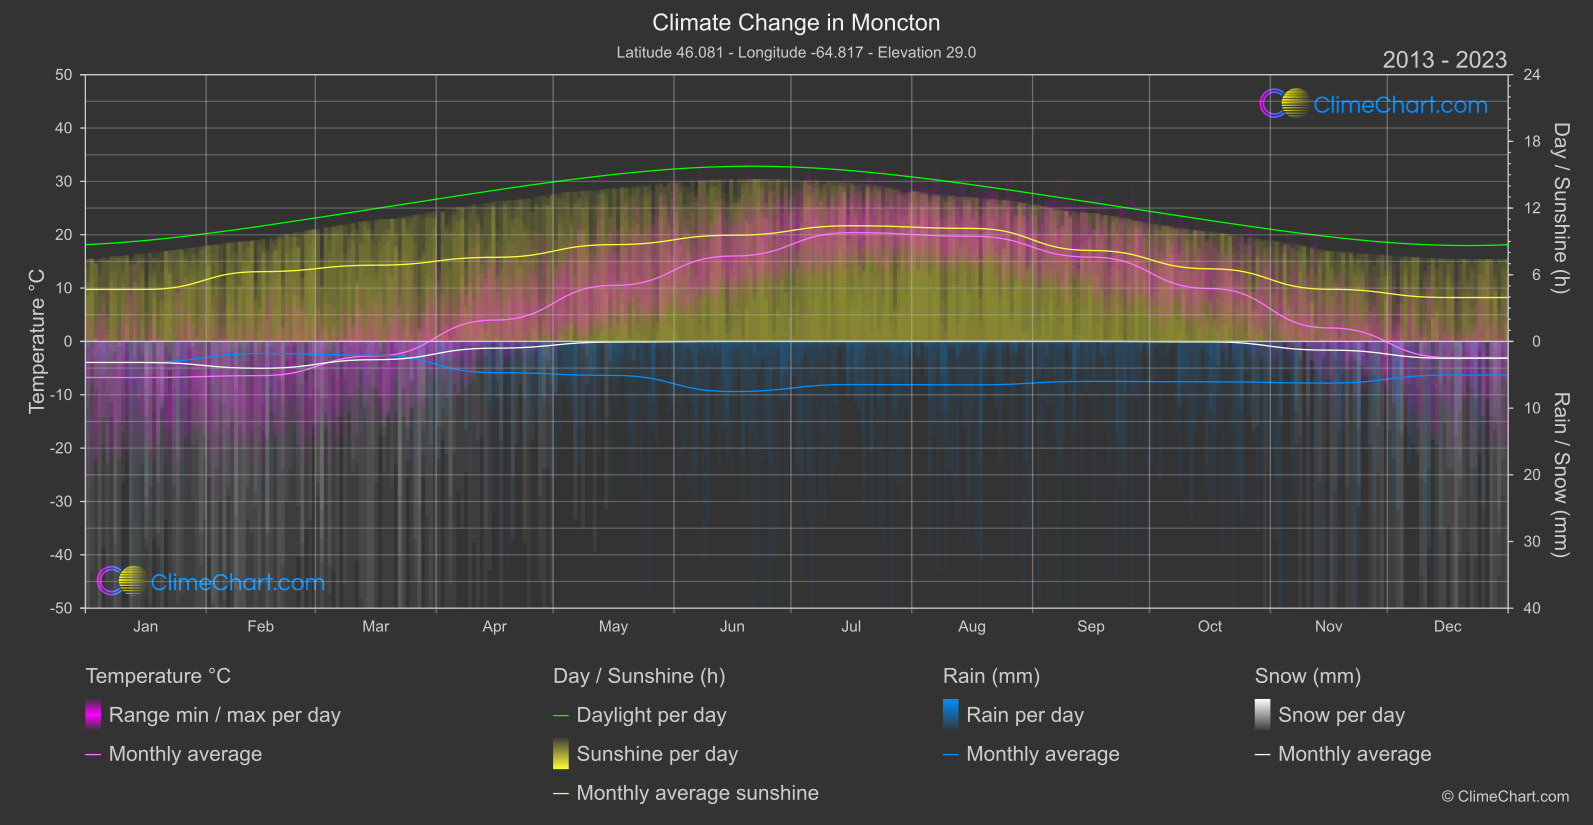
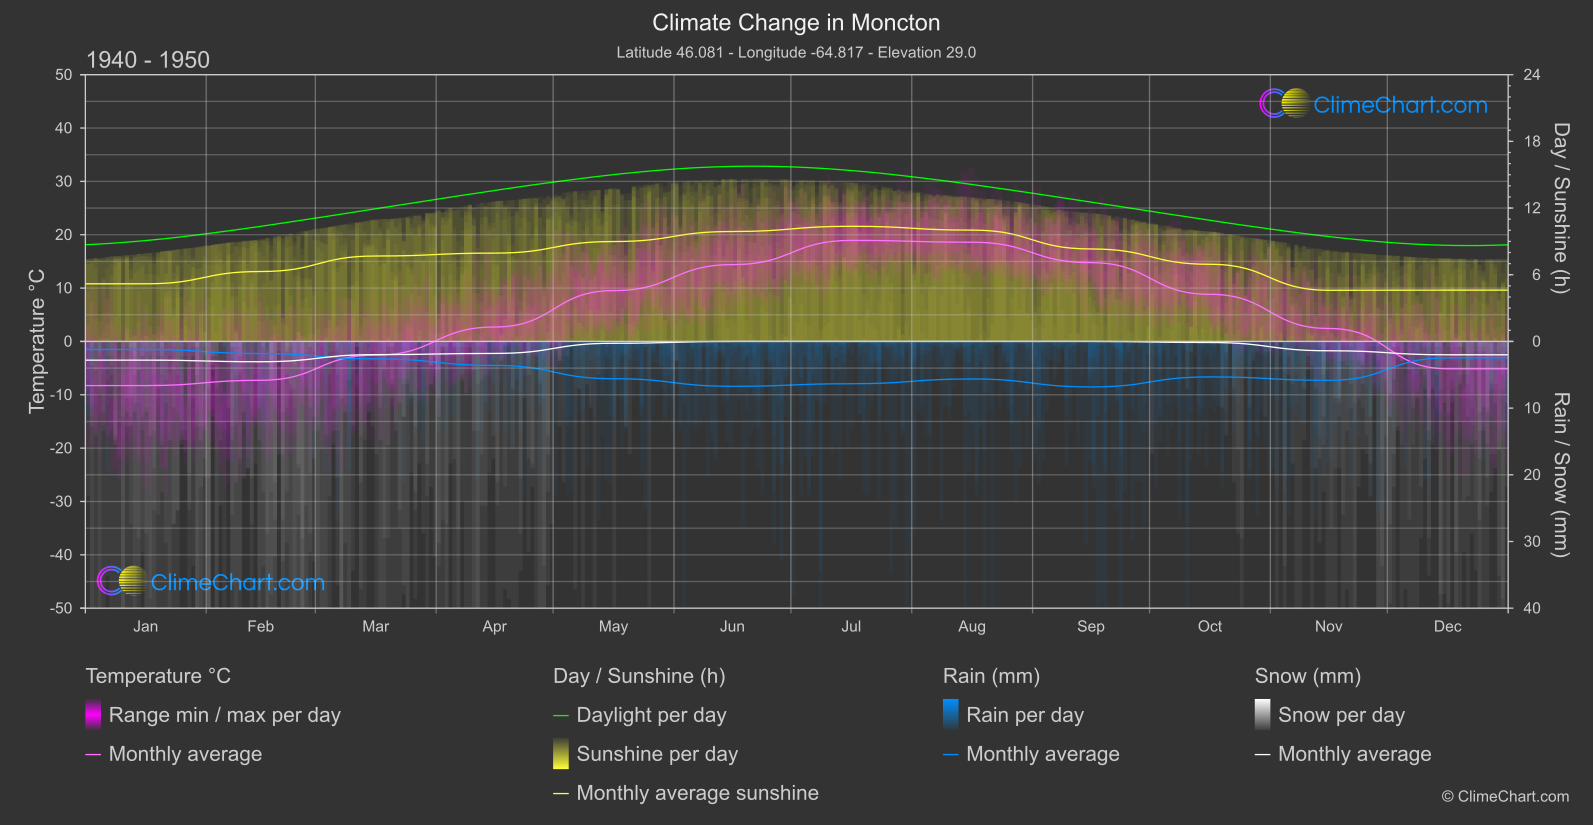
Moncton, Canada, experiences a significant shift in temperature and rainfall patterns. The data from 1940-1950 compared to 2013-2024 shows noticeable changes in various climate indicators. For example, the month of December exhibits a substantial increase in temperature, while September sees a decrease in rainfall. These insights provide a deeper understanding of how climate change is impacting Moncton.
Climate Change Data Overview for Moncton, Canada
Explore the comprehensive climate change data for Moncton, Canada. This detailed table provides valuable insights into temperature variations, precipitation levels, and seasonal changes influenced by climate change, helping you understand the unique weather patterns of this region.
Temperature °C
| Month | ⌀ 1940 - 1950 | ⌀ 2013 - 2023 | +/- |
|---|---|---|---|
| Jan | -8.27 | -6.76 | 1.51 |
| Feb | -7.28 | -6.41 | 0.87 |
| Mar | -2.56 | -2.70 | -0.14 |
| Apr | 2.70 | 4.01 | 1.31 |
| May | 9.53 | 10.50 | 0.97 |
| Jun | 14.40 | 16.00 | 1.61 |
| Jul | 18.94 | 20.40 | 1.46 |
| Aug | 18.60 | 19.72 | 1.12 |
| Sep | 14.77 | 15.80 | 1.03 |
| Oct | 8.83 | 9.91 | 1.08 |
| Nov | 2.43 | 2.53 | 0.10 |
| Dec | -5.13 | -3.00 | 2.12 |
| ⌀ Month | 5.58 | 6.67 | 1.09 |
Sunshine (h)
| Month | ⌀ 1940 - 1950 | ⌀ 2013 - 2023 | +/- |
|---|---|---|---|
| Jan | 5.18 | 4.68 | -0.50 |
| Feb | 6.29 | 6.28 | -0.01 |
| Mar | 7.69 | 6.86 | -0.82 |
| Apr | 7.95 | 7.57 | -0.38 |
| May | 8.99 | 8.71 | -0.28 |
| Jun | 9.89 | 9.56 | -0.34 |
| Jul | 10.36 | 10.41 | 0.05 |
| Aug | 10.01 | 10.17 | 0.16 |
| Sep | 8.32 | 8.19 | -0.13 |
| Oct | 6.94 | 6.53 | -0.40 |
| Nov | 4.60 | 4.69 | 0.09 |
| Dec | 4.61 | 3.95 | -0.66 |
| ⌀ Month | 7.57 | 7.30 | -0.27 |
Rain (mm)
| Month | ⌀ 1940 - 1950 | ⌀ 2013 - 2023 | +/- |
|---|---|---|---|
| Jan | 0.60 | 1.54 | 0.94 |
| Feb | 0.91 | 0.91 | -0.01 |
| Mar | 1.31 | 1.04 | -0.27 |
| Apr | 1.80 | 2.34 | 0.54 |
| May | 2.80 | 2.55 | -0.25 |
| Jun | 3.36 | 3.76 | 0.40 |
| Jul | 3.17 | 3.23 | 0.06 |
| Aug | 2.81 | 3.26 | 0.44 |
| Sep | 3.41 | 2.99 | -0.42 |
| Oct | 2.66 | 3.03 | 0.37 |
| Nov | 2.92 | 3.12 | 0.20 |
| Dec | 1.23 | 2.52 | 1.29 |
| ⌀ Month | 2.25 | 2.52 | 0.28 |
Snow (mm)
| Month | ⌀ 1940 - 1950 | ⌀ 2013 - 2023 | +/- |
|---|---|---|---|
| Jan | 1.40 | 1.58 | 0.17 |
| Feb | 1.52 | 2.01 | 0.49 |
| Mar | 0.99 | 1.37 | 0.38 |
| Apr | 0.90 | 0.50 | -0.40 |
| May | 0.14 | 0.04 | -0.09 |
| Jun | 0.00 | 0.00 | -0.00 |
| Jul | 0.00 | 0.00 | 0.00 |
| Aug | 0.00 | 0.00 | 0.00 |
| Sep | 0.00 | 0.00 | 0.00 |
| Oct | 0.08 | 0.04 | -0.05 |
| Nov | 0.70 | 0.65 | -0.05 |
| Dec | 1.00 | 1.26 | 0.26 |
| ⌀ Month | 0.56 | 0.62 | 0.06 |