Climate Change Chart of Bangkok, Thailand
Comprehensive Climate Change Chart of Bangkok, Thailand: Monthly Averages and Impact Trends
Exploring the changing climate in Bangkok, Thailand reveals intriguing patterns in temperature, rainfall, and sunshine duration over the years. Let's delve into the data to uncover key insights.
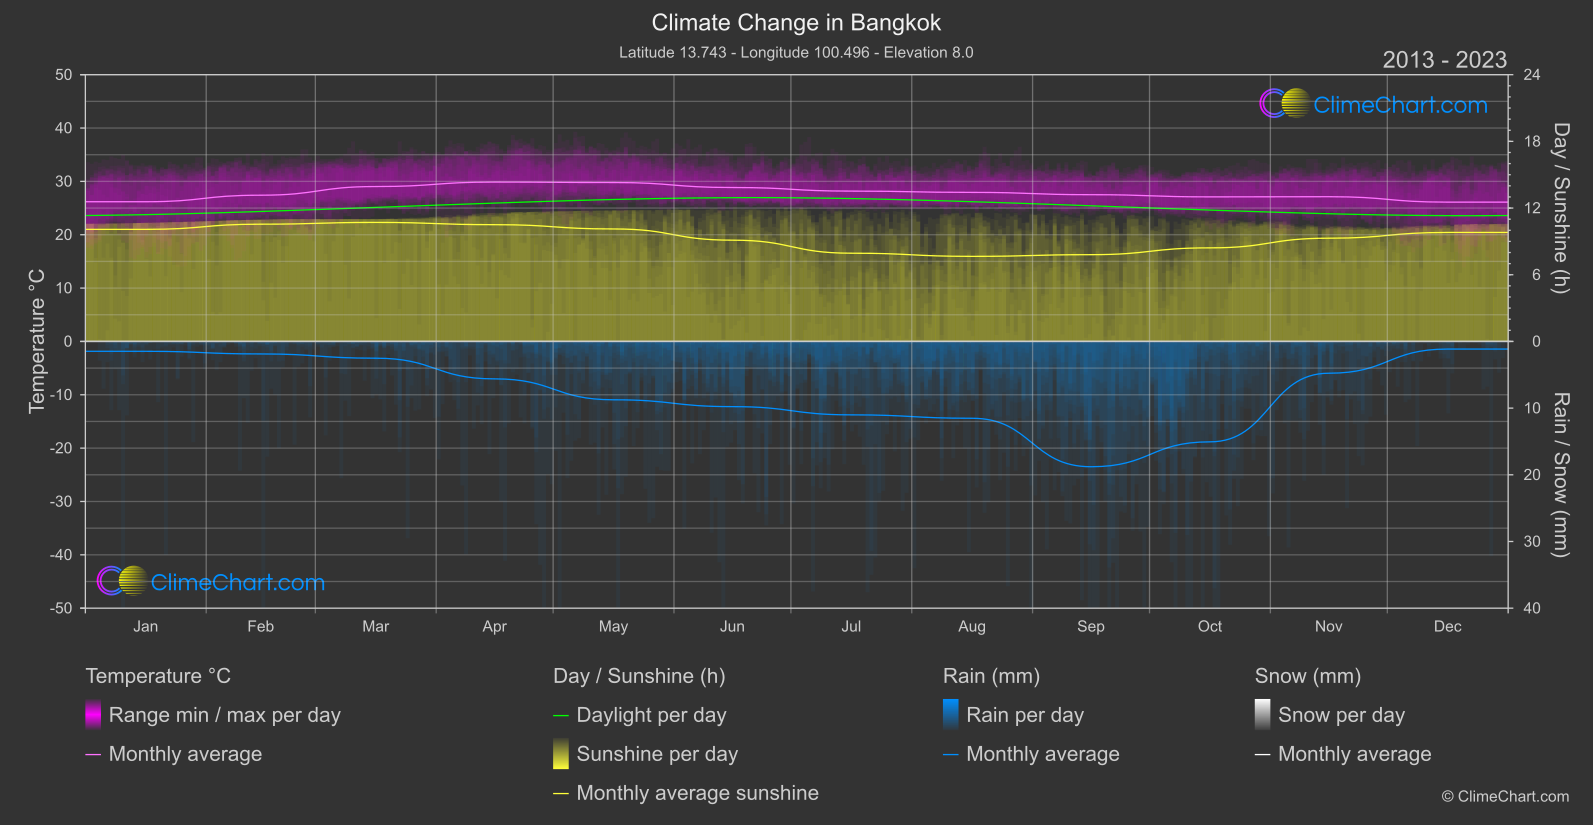
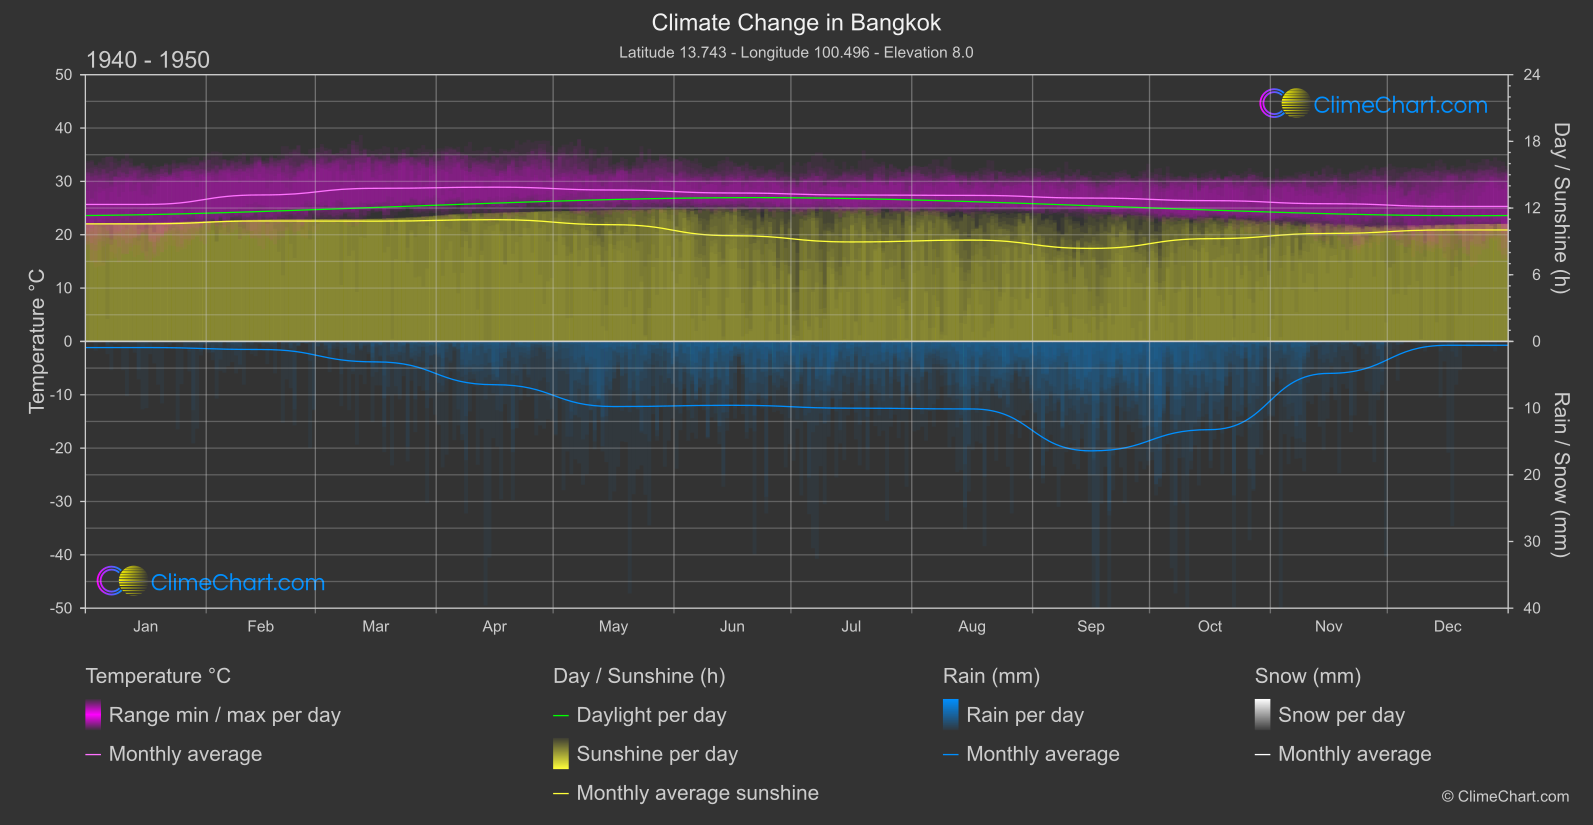
Bangkok, the capital city of Thailand, has been experiencing notable changes in its climate over the years. Analyzing the temperature data from 1940 to 1950 compared to 2013 to 2024, we observe that the month of May has shown the highest increase in temperature, with a rise of 1.40°C. On the other hand, the month of November displayed the most significant temperature change, increasing by 1.32°C. When it comes to rainfall, September saw the largest increase in precipitation with a rise of 1.19 mm. Conversely, the month of November experienced a slight decrease in rainfall by 0.01 mm. Regarding sunshine duration, August had the most substantial decline with a decrease of 1.46 hours of sunshine.
Climate Change Data Overview for Bangkok, Thailand
Explore the comprehensive climate change data for Bangkok, Thailand. This detailed table provides valuable insights into temperature variations, precipitation levels, and seasonal changes influenced by climate change, helping you understand the unique weather patterns of this region.
Temperature °C
| Month | ⌀ 1940 - 1950 | ⌀ 2013 - 2023 | +/- |
|---|---|---|---|
| Jan | 25.68 | 26.18 | 0.50 |
| Feb | 27.46 | 27.41 | -0.05 |
| Mar | 28.70 | 29.03 | 0.33 |
| Apr | 28.91 | 29.87 | 0.96 |
| May | 28.38 | 29.79 | 1.40 |
| Jun | 27.83 | 28.85 | 1.03 |
| Jul | 27.45 | 28.18 | 0.73 |
| Aug | 27.37 | 27.94 | 0.56 |
| Sep | 26.87 | 27.51 | 0.63 |
| Oct | 26.39 | 27.10 | 0.71 |
| Nov | 25.81 | 27.13 | 1.32 |
| Dec | 25.31 | 26.11 | 0.80 |
| ⌀ Month | 27.18 | 27.92 | 0.74 |
Sunshine (h)
| Month | ⌀ 1940 - 1950 | ⌀ 2013 - 2023 | +/- |
|---|---|---|---|
| Jan | 10.58 | 10.08 | -0.50 |
| Feb | 10.84 | 10.55 | -0.29 |
| Mar | 10.82 | 10.71 | -0.11 |
| Apr | 10.96 | 10.50 | -0.45 |
| May | 10.50 | 10.12 | -0.38 |
| Jun | 9.52 | 9.11 | -0.40 |
| Jul | 8.95 | 7.94 | -1.01 |
| Aug | 9.12 | 7.65 | -1.46 |
| Sep | 8.37 | 7.81 | -0.56 |
| Oct | 9.24 | 8.42 | -0.83 |
| Nov | 9.72 | 9.29 | -0.43 |
| Dec | 10.03 | 9.81 | -0.22 |
| ⌀ Month | 9.89 | 9.33 | -0.55 |
Rain (mm)
| Month | ⌀ 1940 - 1950 | ⌀ 2013 - 2023 | +/- |
|---|---|---|---|
| Jan | 0.46 | 0.74 | 0.28 |
| Feb | 0.60 | 0.94 | 0.33 |
| Mar | 1.53 | 1.26 | -0.28 |
| Apr | 3.24 | 2.81 | -0.44 |
| May | 4.88 | 4.38 | -0.51 |
| Jun | 4.79 | 4.89 | 0.10 |
| Jul | 5.00 | 5.51 | 0.50 |
| Aug | 5.06 | 5.76 | 0.70 |
| Sep | 8.20 | 9.39 | 1.19 |
| Oct | 6.61 | 7.53 | 0.91 |
| Nov | 2.40 | 2.38 | -0.01 |
| Dec | 0.29 | 0.57 | 0.28 |
| ⌀ Month | 3.59 | 3.85 | 0.26 |
Snow (mm)
| Month | ⌀ 1940 - 1950 | ⌀ 2013 - 2023 | +/- |
|---|---|---|---|
| Jan | 0.00 | 0.00 | 0.00 |
| Feb | 0.00 | 0.00 | 0.00 |
| Mar | 0.00 | 0.00 | 0.00 |
| Apr | 0.00 | 0.00 | 0.00 |
| May | 0.00 | 0.00 | 0.00 |
| Jun | 0.00 | 0.00 | 0.00 |
| Jul | 0.00 | 0.00 | 0.00 |
| Aug | 0.00 | 0.00 | 0.00 |
| Sep | 0.00 | 0.00 | 0.00 |
| Oct | 0.00 | 0.00 | 0.00 |
| Nov | 0.00 | 0.00 | 0.00 |
| Dec | 0.00 | 0.00 | 0.00 |
| ⌀ Month | 0.00 | 0.00 | 0.00 |