Climate Change Chart of Ottawa, Canada
Comprehensive Climate Change Chart of Ottawa, Canada: Monthly Averages and Impact Trends
Explore the changing climate in Ottawa, Canada, through insightful data analysis.
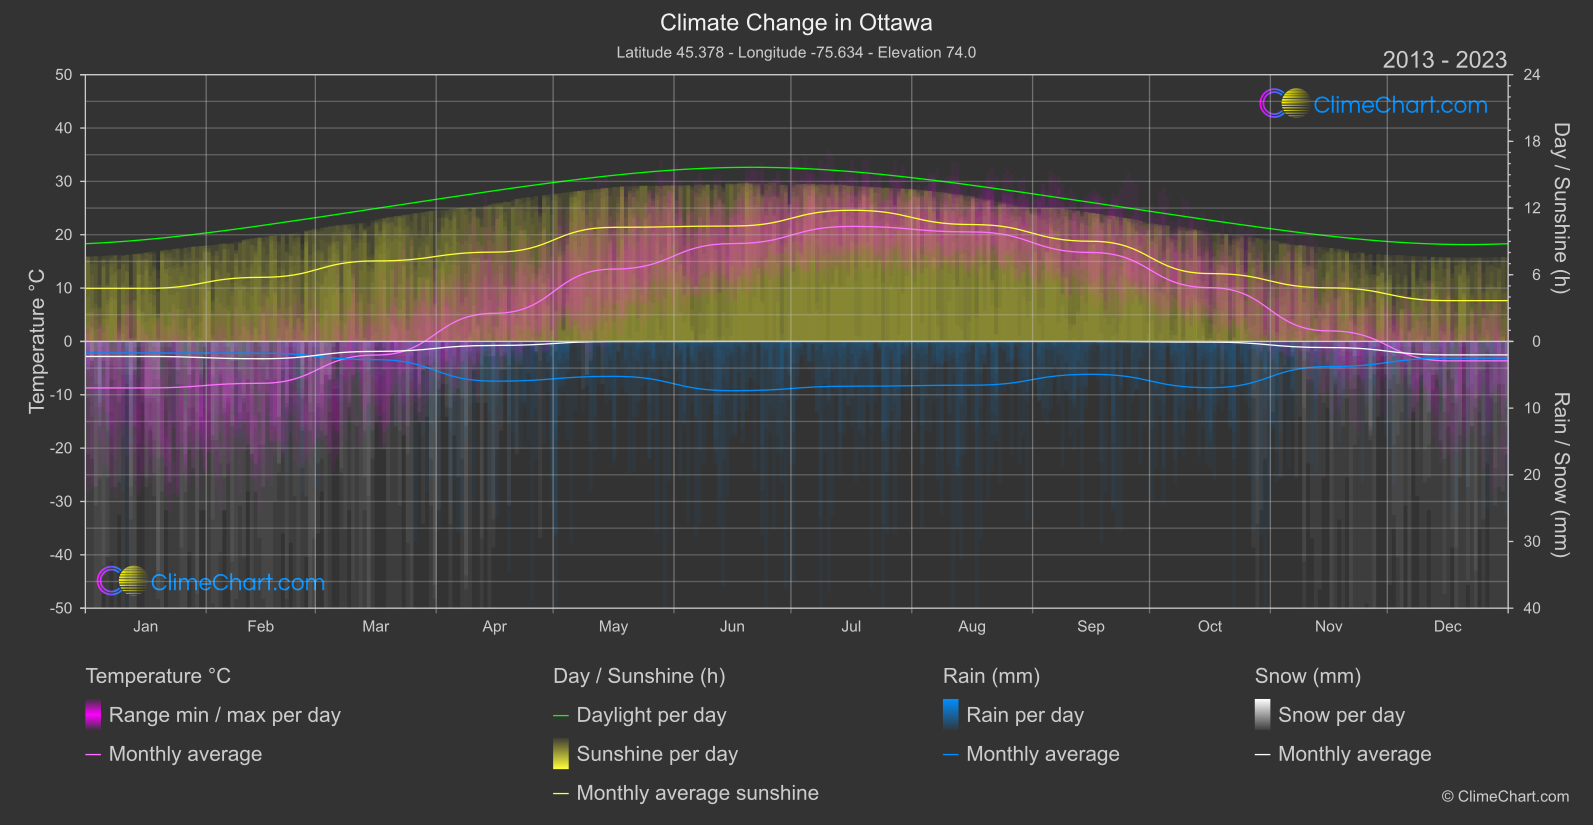
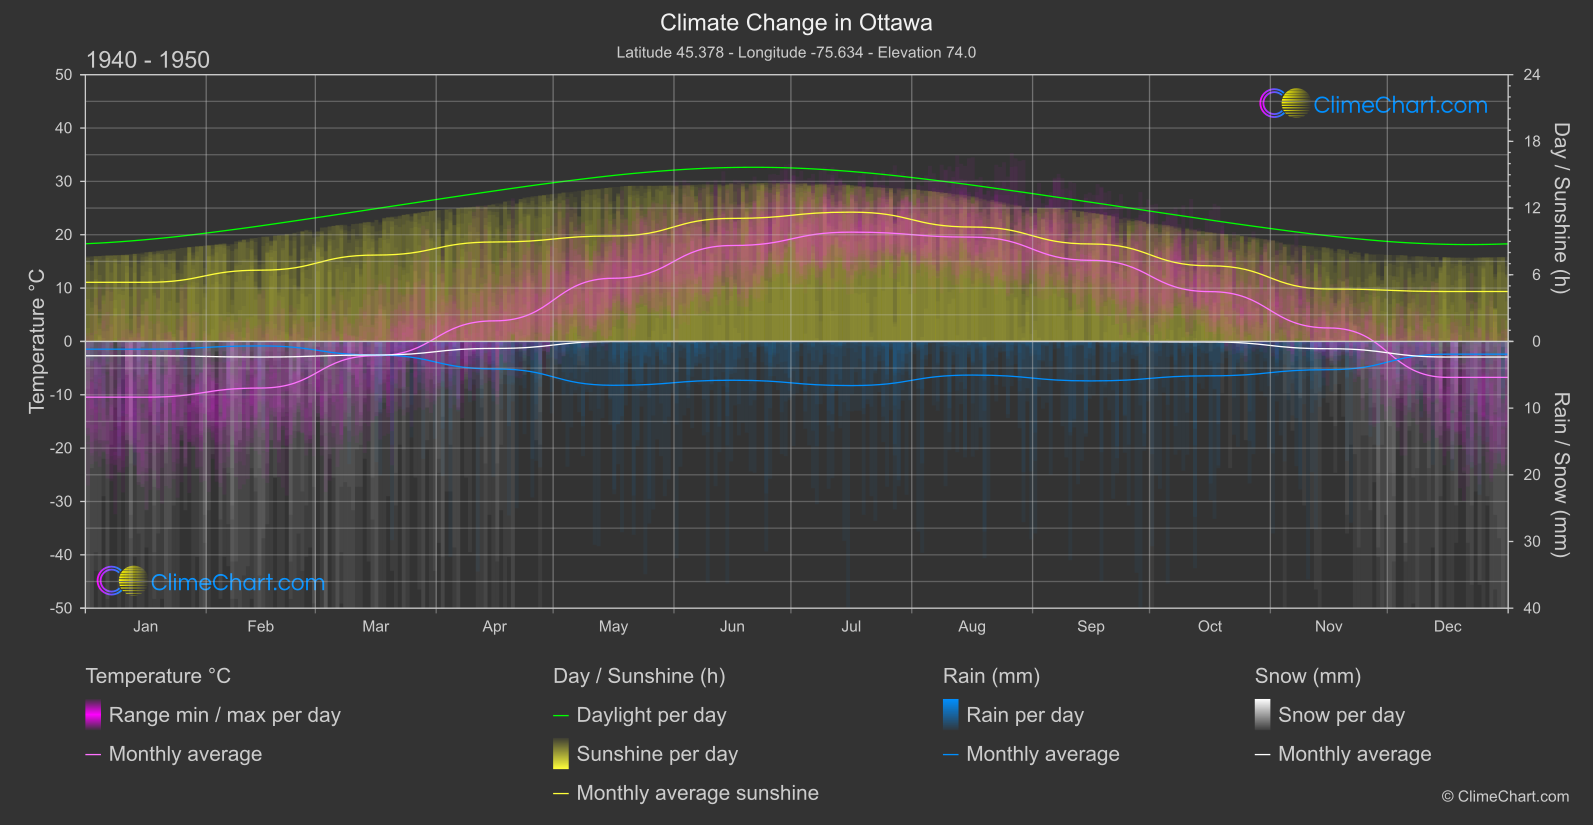
Ottawa, the capital city of Canada, experiences noticeable changes in temperature, rainfall, snowfall, and sunshine duration over the years. Analyzing data from 1940 to 1950 compared to 2013 to 2024 reveals interesting insights. For instance, the month of December shows a significant increase in temperature, while the month of May experiences a decline in rainfall. Understanding these patterns can provide valuable information for climate change adaptation strategies.
Climate Change Data Overview for Ottawa, Canada
Explore the comprehensive climate change data for Ottawa, Canada. This detailed table provides valuable insights into temperature variations, precipitation levels, and seasonal changes influenced by climate change, helping you understand the unique weather patterns of this region.
Temperature °C
| Month | ⌀ 1940 - 1950 | ⌀ 2013 - 2023 | +/- |
|---|---|---|---|
| Jan | -10.45 | -8.72 | 1.73 |
| Feb | -8.74 | -7.85 | 0.89 |
| Mar | -2.67 | -2.56 | 0.11 |
| Apr | 3.86 | 5.27 | 1.41 |
| May | 11.84 | 13.56 | 1.72 |
| Jun | 17.98 | 18.34 | 0.36 |
| Jul | 20.49 | 21.56 | 1.08 |
| Aug | 19.56 | 20.53 | 0.97 |
| Sep | 15.20 | 16.67 | 1.48 |
| Oct | 9.34 | 10.08 | 0.74 |
| Nov | 2.53 | 1.98 | -0.55 |
| Dec | -6.74 | -3.64 | 3.10 |
| ⌀ Month | 6.02 | 7.10 | 1.09 |
Sunshine (h)
| Month | ⌀ 1940 - 1950 | ⌀ 2013 - 2023 | +/- |
|---|---|---|---|
| Jan | 5.32 | 4.77 | -0.55 |
| Feb | 6.41 | 5.77 | -0.65 |
| Mar | 7.77 | 7.24 | -0.53 |
| Apr | 8.95 | 8.04 | -0.91 |
| May | 9.49 | 10.27 | 0.78 |
| Jun | 11.07 | 10.38 | -0.69 |
| Jul | 11.63 | 11.80 | 0.17 |
| Aug | 10.29 | 10.52 | 0.22 |
| Sep | 8.77 | 9.01 | 0.24 |
| Oct | 6.80 | 6.11 | -0.70 |
| Nov | 4.72 | 4.82 | 0.10 |
| Dec | 4.49 | 3.67 | -0.82 |
| ⌀ Month | 7.98 | 7.70 | -0.28 |
Rain (mm)
| Month | ⌀ 1940 - 1950 | ⌀ 2013 - 2023 | +/- |
|---|---|---|---|
| Jan | 0.58 | 0.87 | 0.28 |
| Feb | 0.34 | 0.88 | 0.54 |
| Mar | 1.02 | 1.36 | 0.35 |
| Apr | 2.06 | 2.98 | 0.92 |
| May | 3.29 | 2.62 | -0.67 |
| Jun | 2.91 | 3.70 | 0.79 |
| Jul | 3.31 | 3.36 | 0.05 |
| Aug | 2.52 | 3.28 | 0.76 |
| Sep | 2.96 | 2.46 | -0.49 |
| Oct | 2.58 | 3.47 | 0.89 |
| Nov | 2.12 | 1.88 | -0.23 |
| Dec | 0.95 | 1.25 | 0.30 |
| ⌀ Month | 2.05 | 2.34 | 0.29 |
Snow (mm)
| Month | ⌀ 1940 - 1950 | ⌀ 2013 - 2023 | +/- |
|---|---|---|---|
| Jan | 1.08 | 1.13 | 0.05 |
| Feb | 1.17 | 1.30 | 0.13 |
| Mar | 1.02 | 0.75 | -0.27 |
| Apr | 0.53 | 0.30 | -0.23 |
| May | 0.00 | 0.01 | 0.00 |
| Jun | 0.00 | 0.00 | 0.00 |
| Jul | 0.00 | 0.00 | 0.00 |
| Aug | 0.00 | 0.00 | 0.00 |
| Sep | 0.00 | 0.00 | 0.00 |
| Oct | 0.04 | 0.05 | 0.01 |
| Nov | 0.55 | 0.46 | -0.09 |
| Dec | 1.17 | 1.01 | -0.16 |
| ⌀ Month | 0.46 | 0.42 | -0.05 |