Climate Change Chart of Kicking Horse, Canada
Comprehensive Climate Change Chart of Kicking Horse, Canada: Monthly Averages and Impact Trends
Exploring the changing climate trends in Kicking Horse, Canada reveals intriguing insights into temperature, rainfall, snowfall, and sunshine duration over the years.
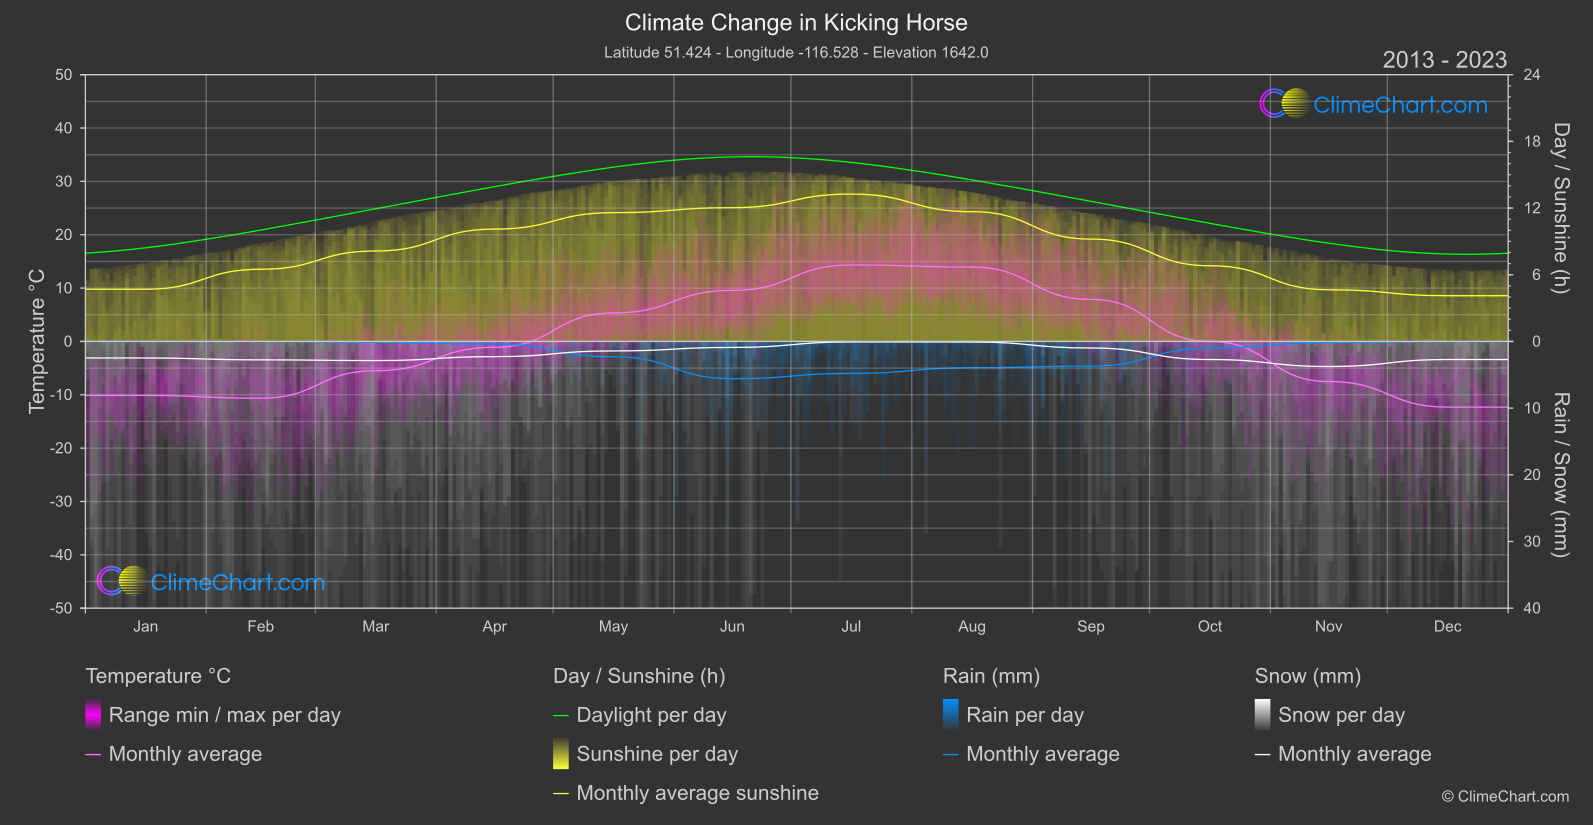
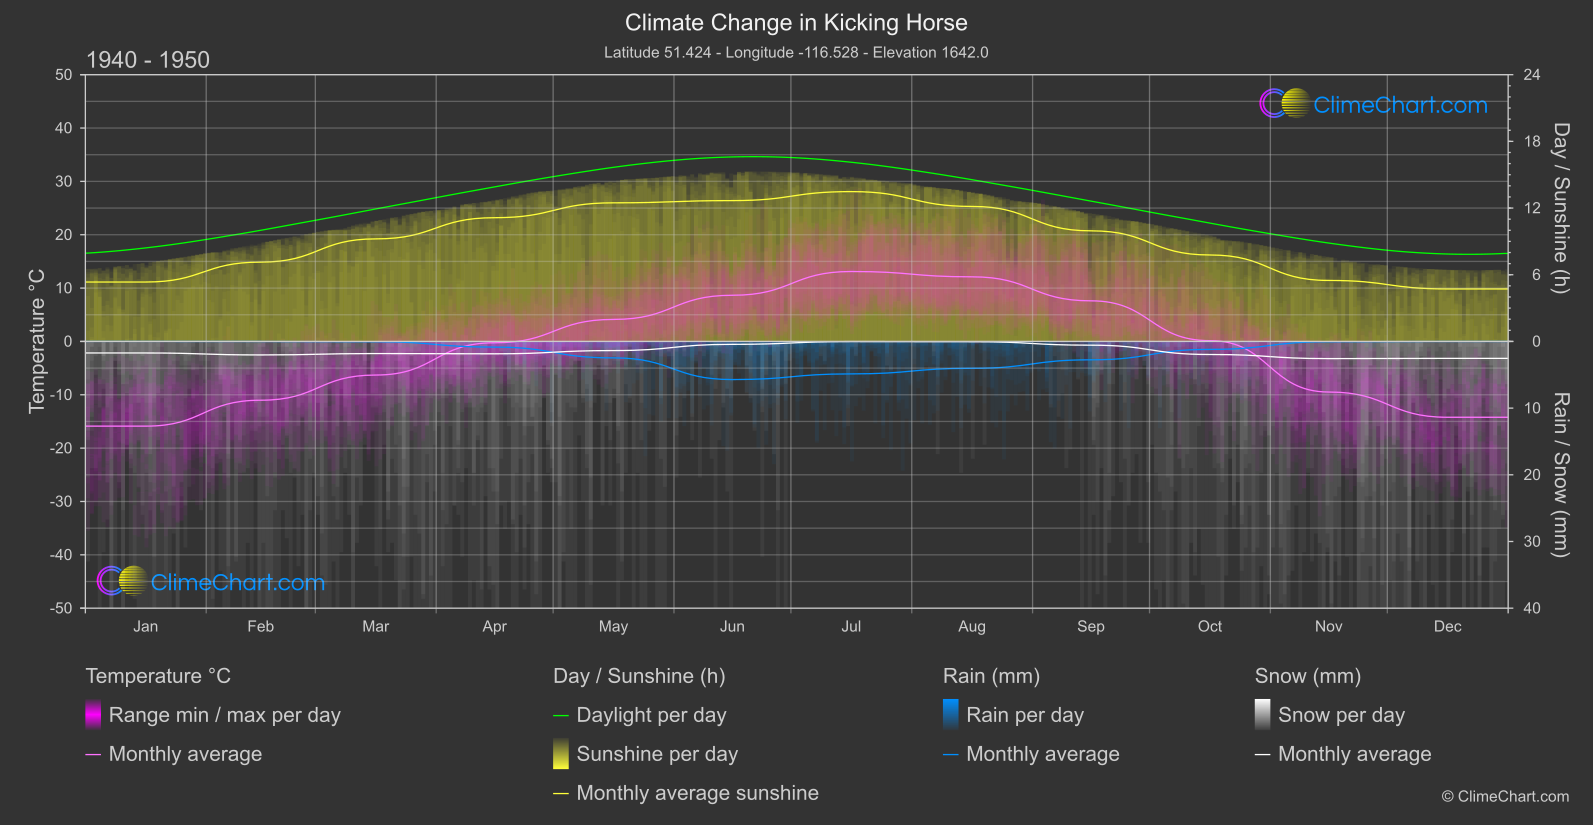
Kicking Horse, Canada, has experienced notable changes in climate parameters. The data showcases temperature shifts, with the highest change occurring in November. Furthermore, the comparison of rainfall data indicates significant variations, particularly in September. Snowfall patterns have also altered, notably in November. Additionally, the duration of sunshine has shown fluctuations, with the most substantial change in March.
Climate Change Data Overview for Kicking Horse, Canada
Explore the comprehensive climate change data for Kicking Horse, Canada. This detailed table provides valuable insights into temperature variations, precipitation levels, and seasonal changes influenced by climate change, helping you understand the unique weather patterns of this region.
Temperature °C
| Month | ⌀ 1940 - 1950 | ⌀ 2013 - 2023 | +/- |
|---|---|---|---|
| Jan | -15.88 | -10.12 | 5.75 |
| Feb | -11.02 | -10.64 | 0.37 |
| Mar | -6.30 | -5.50 | 0.80 |
| Apr | -0.25 | -1.09 | -0.84 |
| May | 4.12 | 5.35 | 1.22 |
| Jun | 8.65 | 9.57 | 0.91 |
| Jul | 13.11 | 14.33 | 1.23 |
| Aug | 12.11 | 13.94 | 1.83 |
| Sep | 7.61 | 7.88 | 0.27 |
| Oct | 0.15 | -0.00 | -0.15 |
| Nov | -9.48 | -7.52 | 1.97 |
| Dec | -14.22 | -12.31 | 1.91 |
| ⌀ Month | -0.95 | 0.32 | 1.27 |
Sunshine (h)
| Month | ⌀ 1940 - 1950 | ⌀ 2013 - 2023 | +/- |
|---|---|---|---|
| Jan | 5.35 | 4.70 | -0.65 |
| Feb | 7.14 | 6.49 | -0.64 |
| Mar | 9.23 | 8.14 | -1.09 |
| Apr | 11.13 | 10.11 | -1.02 |
| May | 12.47 | 11.59 | -0.88 |
| Jun | 12.67 | 12.04 | -0.63 |
| Jul | 13.48 | 13.26 | -0.22 |
| Aug | 12.15 | 11.67 | -0.47 |
| Sep | 9.95 | 9.21 | -0.74 |
| Oct | 7.78 | 6.81 | -0.97 |
| Nov | 5.49 | 4.65 | -0.84 |
| Dec | 4.72 | 4.11 | -0.61 |
| ⌀ Month | 9.30 | 8.56 | -0.73 |
Rain (mm)
| Month | ⌀ 1940 - 1950 | ⌀ 2013 - 2023 | +/- |
|---|---|---|---|
| Jan | 0.00 | 0.01 | 0.01 |
| Feb | 0.00 | 0.01 | 0.01 |
| Mar | 0.02 | 0.07 | 0.05 |
| Apr | 0.43 | 0.20 | -0.23 |
| May | 1.23 | 1.15 | -0.09 |
| Jun | 2.86 | 2.80 | -0.06 |
| Jul | 2.43 | 2.40 | -0.04 |
| Aug | 2.01 | 1.97 | -0.04 |
| Sep | 1.38 | 1.85 | 0.47 |
| Oct | 0.60 | 0.50 | -0.09 |
| Nov | 0.02 | 0.08 | 0.05 |
| Dec | 0.00 | 0.02 | 0.01 |
| ⌀ Month | 0.92 | 0.92 | 0.00 |
Snow (mm)
| Month | ⌀ 1940 - 1950 | ⌀ 2013 - 2023 | +/- |
|---|---|---|---|
| Jan | 0.87 | 1.24 | 0.37 |
| Feb | 1.01 | 1.38 | 0.37 |
| Mar | 0.91 | 1.44 | 0.53 |
| Apr | 0.93 | 1.14 | 0.21 |
| May | 0.68 | 0.71 | 0.03 |
| Jun | 0.22 | 0.45 | 0.23 |
| Jul | 0.01 | 0.04 | 0.03 |
| Aug | 0.02 | 0.04 | 0.02 |
| Sep | 0.28 | 0.49 | 0.21 |
| Oct | 0.98 | 1.36 | 0.38 |
| Nov | 1.29 | 1.88 | 0.59 |
| Dec | 1.27 | 1.36 | 0.09 |
| ⌀ Month | 0.71 | 0.96 | 0.25 |