Climate Change Chart of St. John's, Canada
Comprehensive Climate Change Chart of St. John's, Canada: Monthly Averages and Impact Trends
Explore the changing climate in St. John's, Canada through insightful data analysis. Discover how temperature, rainfall, snowfall, and sunshine duration have evolved from 1940 - 1950 to 2013 - 2024.
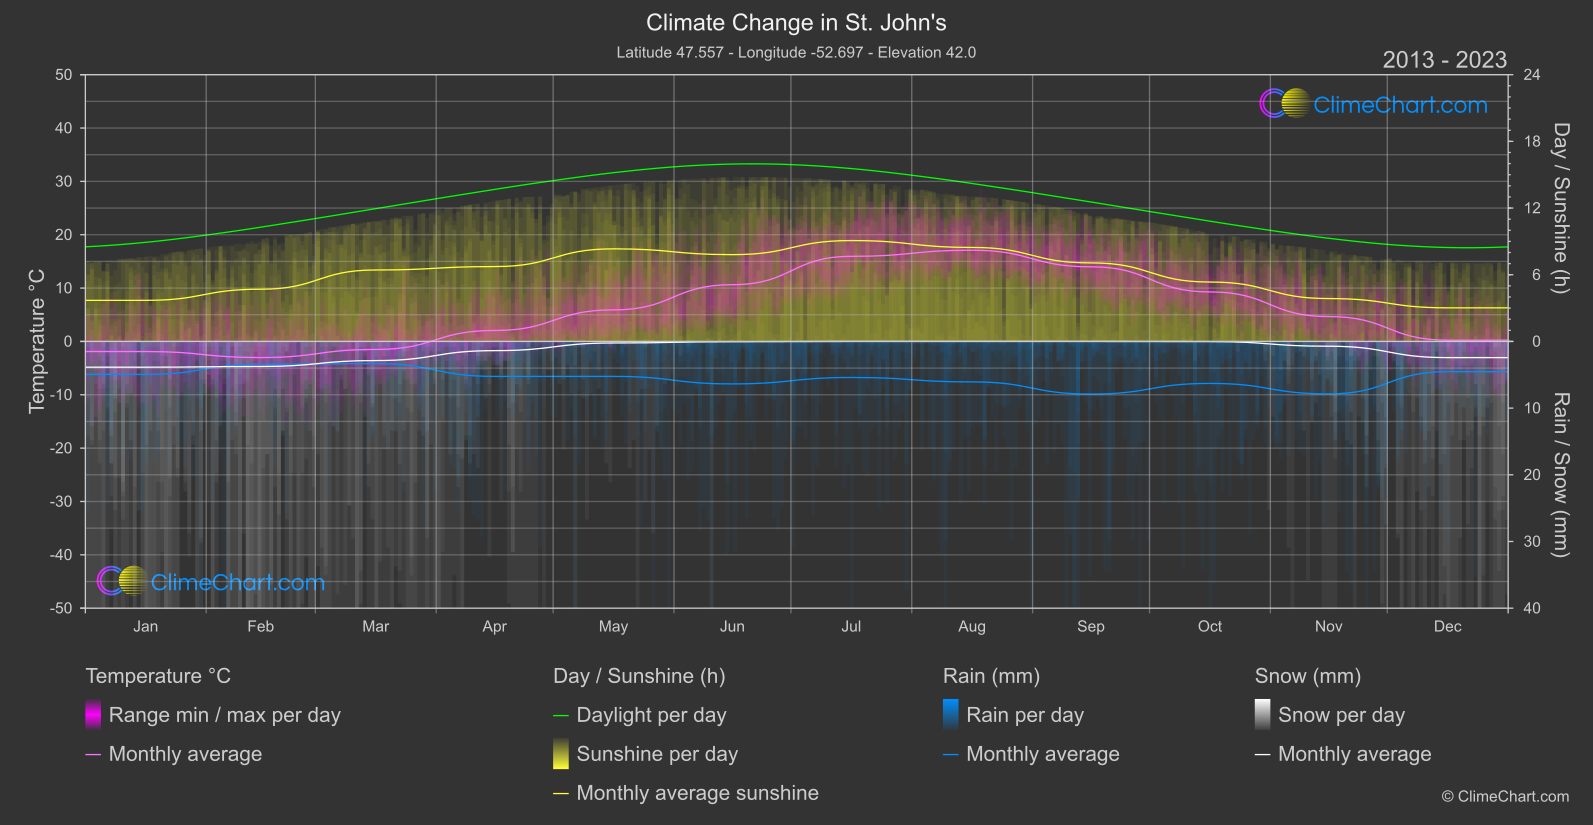
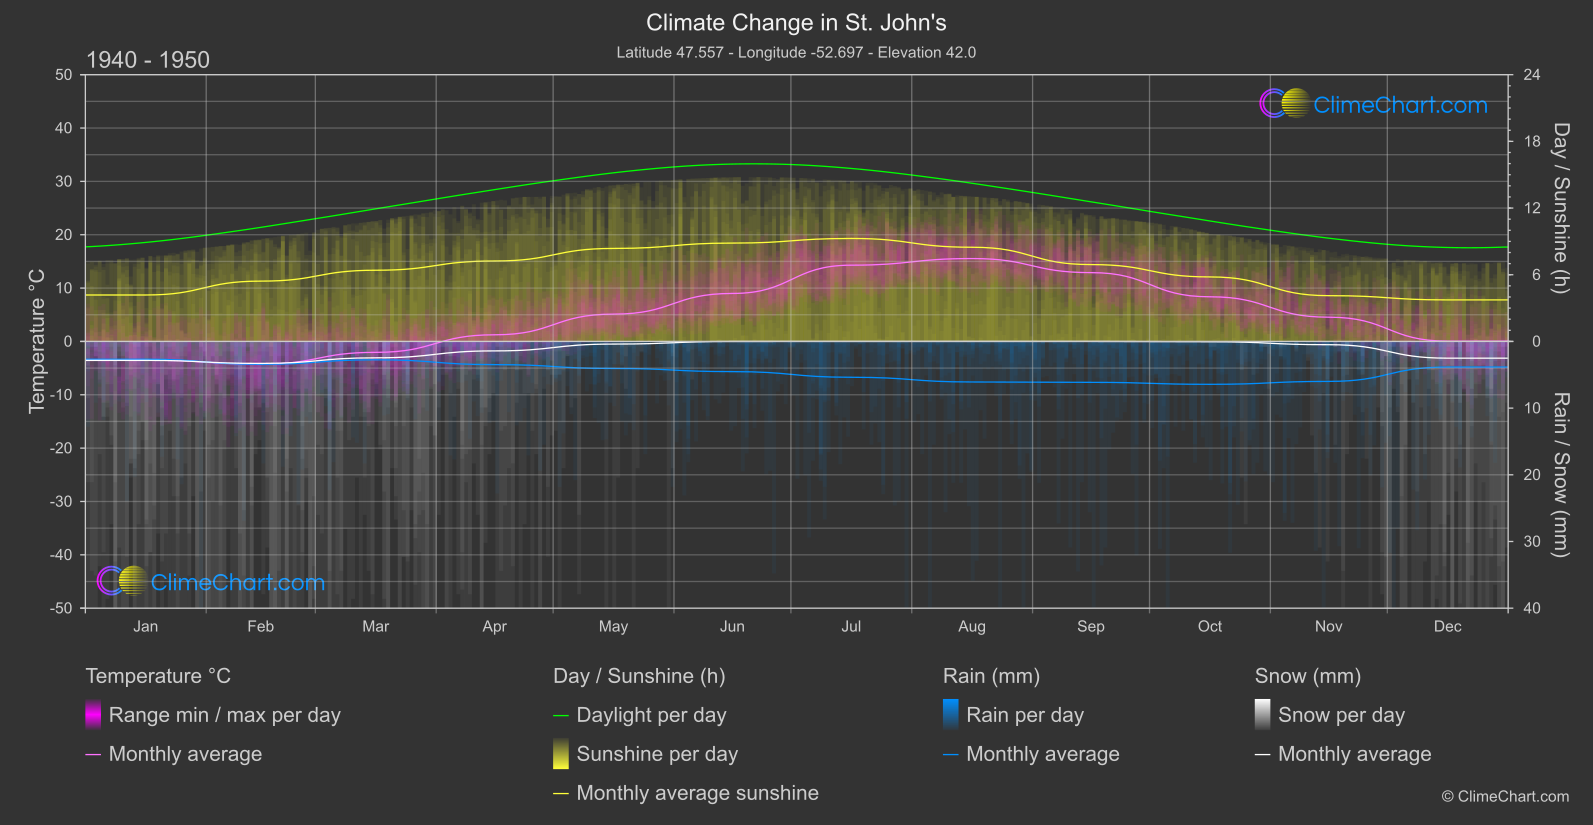
St. John's, Canada, has experienced notable changes in its climate over the years. The data reveals that the month with the highest temperature change is June, with a significant increase of 1.64°C from 1940 - 1950 to 2013 - 2024. In terms of rainfall, September stands out as the month with the most significant change, showing an increase of 0.88 mm. Snowfall has decreased overall, with the most noticeable decline in December. Additionally, the sunshine duration has varied, with June experiencing the largest decrease of 1.04 hours of sunshine.
Climate Change Data Overview for St. John's, Canada
Explore the comprehensive climate change data for St. John's, Canada. This detailed table provides valuable insights into temperature variations, precipitation levels, and seasonal changes influenced by climate change, helping you understand the unique weather patterns of this region.
Temperature °C
| Month | ⌀ 1940 - 1950 | ⌀ 2013 - 2023 | +/- |
|---|---|---|---|
| Jan | -3.46 | -1.90 | 1.57 |
| Feb | -4.25 | -3.02 | 1.23 |
| Mar | -2.05 | -1.50 | 0.54 |
| Apr | 1.24 | 2.05 | 0.81 |
| May | 5.12 | 5.91 | 0.80 |
| Jun | 8.99 | 10.64 | 1.64 |
| Jul | 14.29 | 15.95 | 1.65 |
| Aug | 15.54 | 17.10 | 1.56 |
| Sep | 12.90 | 13.99 | 1.09 |
| Oct | 8.37 | 9.28 | 0.92 |
| Nov | 4.54 | 4.66 | 0.11 |
| Dec | 0.05 | 0.24 | 0.19 |
| ⌀ Month | 5.11 | 6.12 | 1.01 |
Sunshine (h)
| Month | ⌀ 1940 - 1950 | ⌀ 2013 - 2023 | +/- |
|---|---|---|---|
| Jan | 4.18 | 3.70 | -0.48 |
| Feb | 5.43 | 4.70 | -0.73 |
| Mar | 6.41 | 6.43 | 0.02 |
| Apr | 7.24 | 6.74 | -0.50 |
| May | 8.37 | 8.33 | -0.04 |
| Jun | 8.85 | 7.81 | -1.04 |
| Jul | 9.26 | 9.07 | -0.19 |
| Aug | 8.47 | 8.46 | -0.02 |
| Sep | 6.92 | 7.07 | 0.15 |
| Oct | 5.80 | 5.34 | -0.46 |
| Nov | 4.12 | 3.86 | -0.26 |
| Dec | 3.74 | 3.02 | -0.71 |
| ⌀ Month | 6.56 | 6.21 | -0.35 |
Rain (mm)
| Month | ⌀ 1940 - 1950 | ⌀ 2013 - 2023 | +/- |
|---|---|---|---|
| Jan | 1.33 | 2.47 | 1.14 |
| Feb | 1.71 | 1.71 | -0.00 |
| Mar | 1.38 | 1.66 | 0.28 |
| Apr | 1.74 | 2.62 | 0.88 |
| May | 2.03 | 2.62 | 0.59 |
| Jun | 2.26 | 3.18 | 0.92 |
| Jul | 2.69 | 2.70 | 0.01 |
| Aug | 3.04 | 3.03 | -0.01 |
| Sep | 3.07 | 3.95 | 0.88 |
| Oct | 3.22 | 3.15 | -0.07 |
| Nov | 3.00 | 3.93 | 0.94 |
| Dec | 1.92 | 2.27 | 0.35 |
| ⌀ Month | 2.28 | 2.78 | 0.49 |
Snow (mm)
| Month | ⌀ 1940 - 1950 | ⌀ 2013 - 2023 | +/- |
|---|---|---|---|
| Jan | 1.42 | 1.93 | 0.51 |
| Feb | 1.65 | 1.88 | 0.23 |
| Mar | 1.23 | 1.43 | 0.21 |
| Apr | 0.71 | 0.69 | -0.02 |
| May | 0.20 | 0.12 | -0.08 |
| Jun | 0.00 | 0.02 | 0.02 |
| Jul | 0.00 | 0.00 | 0.00 |
| Aug | 0.00 | 0.00 | 0.00 |
| Sep | 0.00 | 0.00 | 0.00 |
| Oct | 0.02 | 0.01 | -0.01 |
| Nov | 0.24 | 0.36 | 0.11 |
| Dec | 1.26 | 1.21 | -0.04 |
| ⌀ Month | 0.56 | 0.64 | 0.08 |