Climate Chart of Kuala Lumpur, Malaysia
Monthly data: Temperature °C, Rain (mm), Sunshine (h) · 2013–2023
Discover the climate of Kuala Lumpur, Malaysia
Climate overview
Temperature
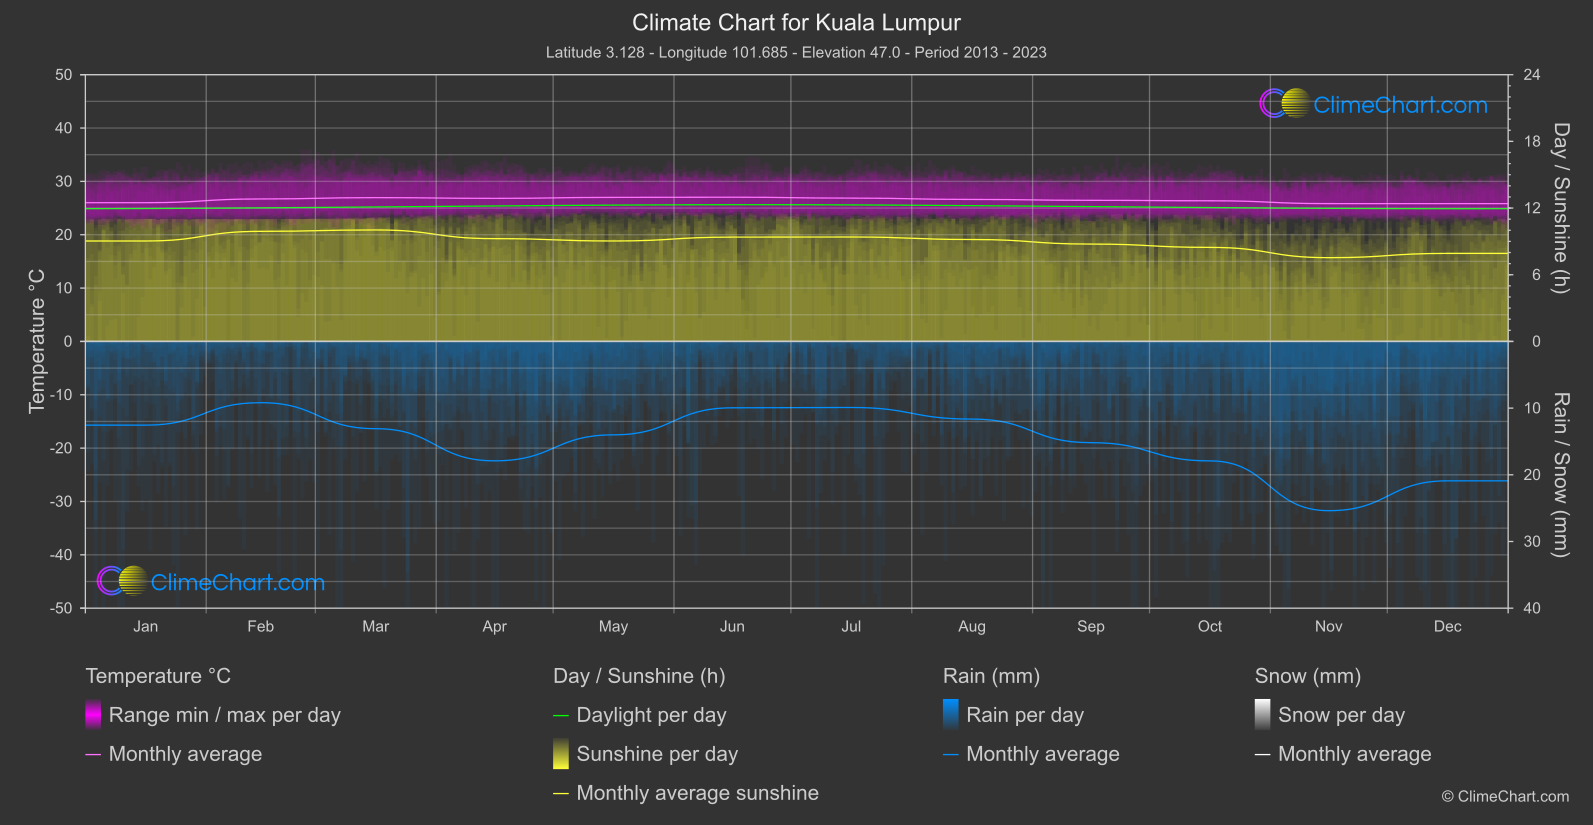
Kuala Lumpur, the capital city of Malaysia, has a tropical rainforest climate. The weather is warm and humid throughout the year with consistent temperatures ranging from 25°C to 33°C.
Rain
Rainfall is common and occurs mostly in the form of short, intense showers. The wettest months are April to May and October to November.
Best Travel Time Guide for Kuala Lumpur, Malaysia: Ideal Seasons and Weather Insights
The best time to visit Kuala Lumpur is during the dry season from June to August when rainfall is lower and the weather is more pleasant. However, as a bustling city with plenty of indoor attractions, Kuala Lumpur can be enjoyed year-round. Remember to pack light clothing, an umbrella, and sunscreen when visiting.
Climate Data Overview for Kuala Lumpur, Malaysia
Explore the comprehensive climate data for Kuala Lumpur, Malaysia. This detailed table provides valuable insights into temperature variations, precipitation levels, and seasonal changes, helping you understand the unique weather patterns of this region.
| Month | Average: Temperature °C | Rain (mm) / day | Snow (mm) / day | Sunshine (h) / day |
|---|---|---|---|---|
| Jan | 26.0 | 6.28 | 0.00 | 9.04 |
| Feb | 26.7 | 4.59 | 0.00 | 9.91 |
| Mar | 27.0 | 6.54 | 0.00 | 10.03 |
| Apr | 26.8 | 8.95 | 0.00 | 9.25 |
| May | 27.0 | 7.00 | 0.00 | 9.04 |
| Jun | 27.0 | 4.98 | 0.00 | 9.39 |
| Jul | 26.9 | 4.95 | 0.00 | 9.40 |
| Aug | 26.6 | 5.82 | 0.00 | 9.17 |
| Sep | 26.4 | 7.59 | 0.00 | 8.76 |
| Oct | 26.4 | 8.96 | 0.00 | 8.46 |
| Nov | 25.8 | 12.69 | 0.00 | 7.54 |
| Dec | 25.8 | 10.45 | 0.00 | 7.92 |
| Average | 26.5 | 7.40 | 0.00 | 8.99 |