Climate Change Chart of Ward Hunt Island, Canada
Comprehensive Climate Change Chart of Ward Hunt Island, Canada: Monthly Averages and Impact Trends
Explore the climate changes in Ward Hunt Island, Canada through insightful data analysis.
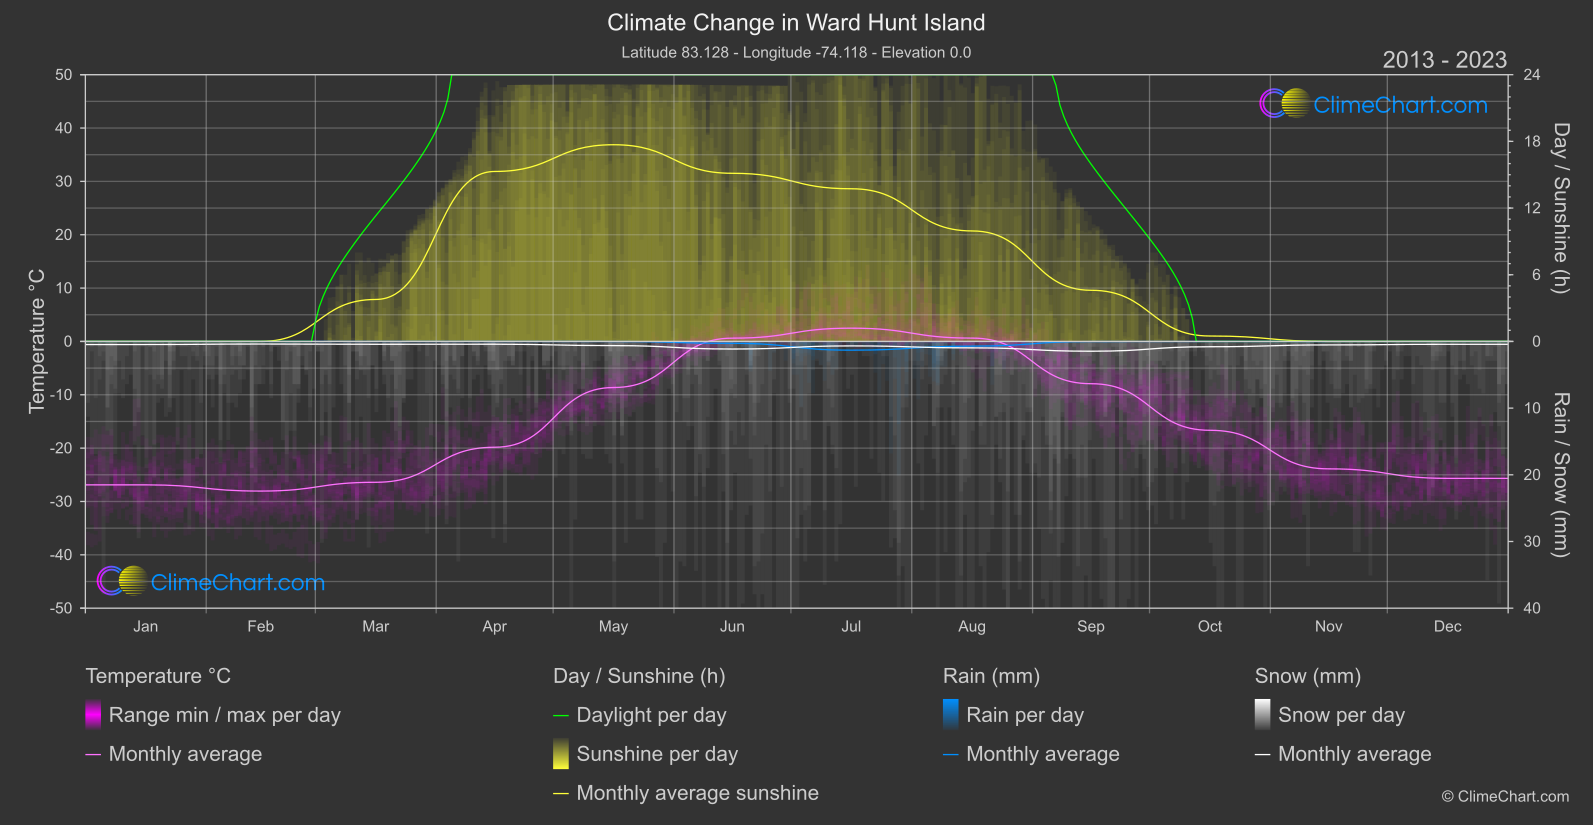
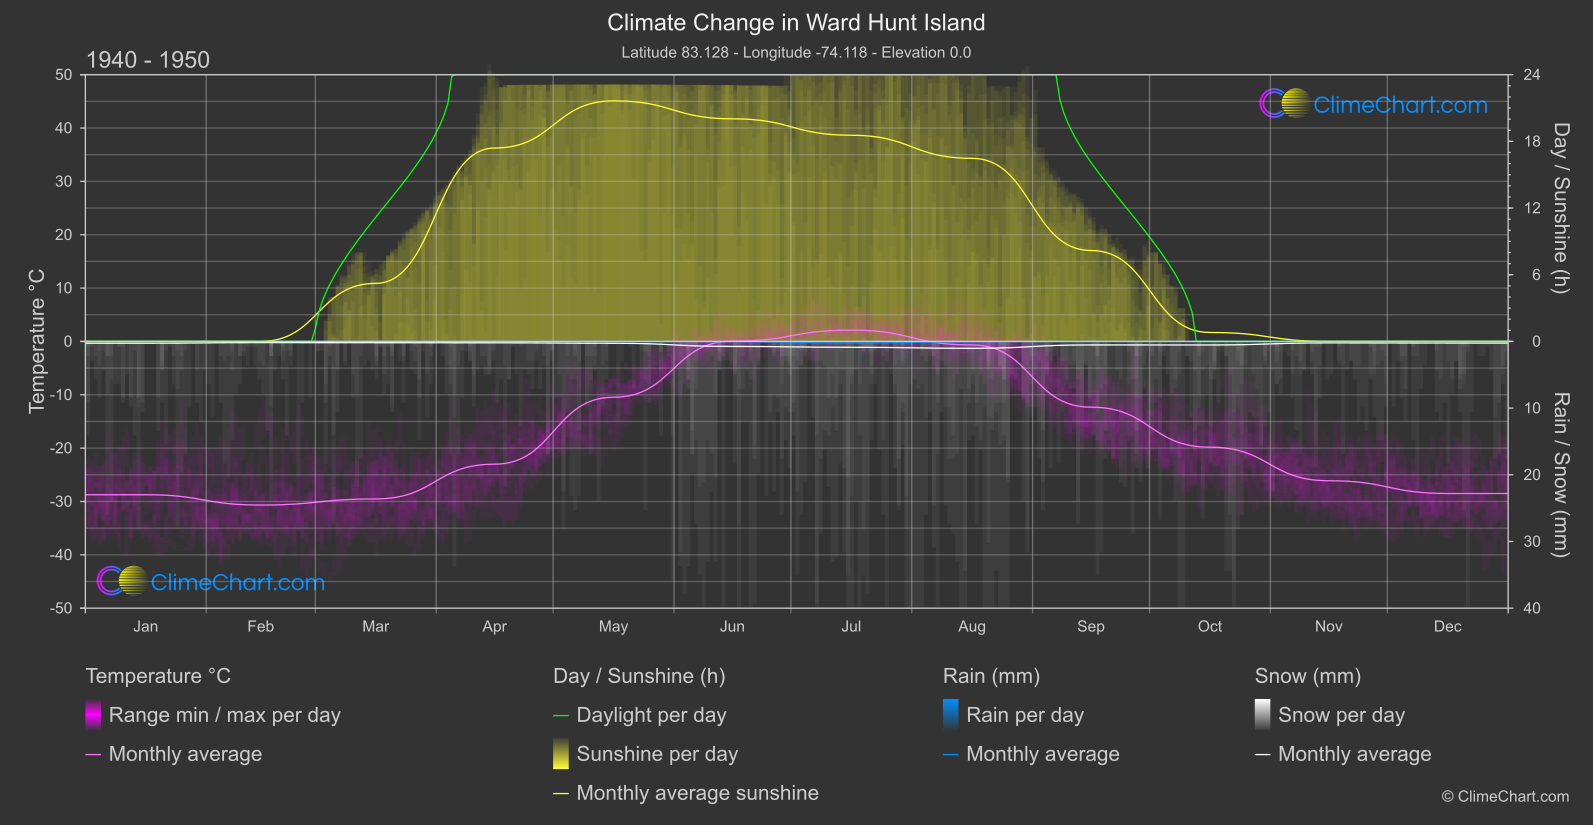
Ward Hunt Island in Canada has experienced significant changes in temperature, rainfall, snowfall, and sunshine duration over the years. The data from the 1940s to 1950s compared to the period of 2013 to 2024 shows varying trends across different months. For instance, September recorded the highest temperature change of 4.40°C, while June had the highest increase in rainfall by 0.12mm. The analysis also reveals fluctuations in snowfall and sunshine duration, highlighting the impact of climate change on this Arctic island.
Climate Change Data Overview for Ward Hunt Island, Canada
Explore the comprehensive climate change data for Ward Hunt Island, Canada. This detailed table provides valuable insights into temperature variations, precipitation levels, and seasonal changes influenced by climate change, helping you understand the unique weather patterns of this region.
Temperature °C
| Month | ⌀ 1940 - 1950 | ⌀ 2013 - 2023 | +/- |
|---|---|---|---|
| Jan | -28.73 | -26.88 | 1.85 |
| Feb | -30.67 | -28.05 | 2.62 |
| Mar | -29.52 | -26.40 | 3.12 |
| Apr | -23.01 | -19.83 | 3.17 |
| May | -10.46 | -8.64 | 1.82 |
| Jun | 0.05 | 0.61 | 0.56 |
| Jul | 2.13 | 2.49 | 0.36 |
| Aug | -0.66 | 0.62 | 1.29 |
| Sep | -12.32 | -7.92 | 4.40 |
| Oct | -19.82 | -16.66 | 3.17 |
| Nov | -26.12 | -23.89 | 2.23 |
| Dec | -28.51 | -25.67 | 2.84 |
| ⌀ Month | -17.30 | -15.02 | 2.29 |
Sunshine (h)
| Month | ⌀ 1940 - 1950 | ⌀ 2013 - 2023 | +/- |
|---|---|---|---|
| Jan | 0.00 | 0.00 | 0.00 |
| Feb | 0.00 | 0.00 | 0.00 |
| Mar | 5.23 | 3.78 | -1.45 |
| Apr | 17.40 | 15.29 | -2.11 |
| May | 21.64 | 17.70 | -3.95 |
| Jun | 20.03 | 15.13 | -4.90 |
| Jul | 18.55 | 13.74 | -4.82 |
| Aug | 16.47 | 9.94 | -6.53 |
| Sep | 8.18 | 4.60 | -3.58 |
| Oct | 0.81 | 0.49 | -0.32 |
| Nov | 0.00 | 0.00 | 0.00 |
| Dec | 0.00 | 0.00 | 0.00 |
| ⌀ Month | 9.03 | 6.72 | -2.30 |
Rain (mm)
| Month | ⌀ 1940 - 1950 | ⌀ 2013 - 2023 | +/- |
|---|---|---|---|
| Jan | 0.00 | 0.00 | 0.00 |
| Feb | 0.00 | 0.00 | 0.00 |
| Mar | 0.00 | 0.00 | 0.00 |
| Apr | 0.00 | 0.00 | 0.00 |
| May | 0.00 | 0.00 | 0.00 |
| Jun | 0.02 | 0.14 | 0.12 |
| Jul | 0.12 | 0.65 | 0.54 |
| Aug | 0.03 | 0.35 | 0.32 |
| Sep | 0.00 | 0.01 | 0.01 |
| Oct | 0.00 | 0.00 | 0.00 |
| Nov | 0.00 | 0.00 | 0.00 |
| Dec | 0.00 | 0.00 | 0.00 |
| ⌀ Month | 0.01 | 0.10 | 0.08 |
Snow (mm)
| Month | ⌀ 1940 - 1950 | ⌀ 2013 - 2023 | +/- |
|---|---|---|---|
| Jan | 0.13 | 0.23 | 0.10 |
| Feb | 0.09 | 0.19 | 0.11 |
| Mar | 0.10 | 0.21 | 0.12 |
| Apr | 0.10 | 0.21 | 0.10 |
| May | 0.14 | 0.31 | 0.18 |
| Jun | 0.37 | 0.57 | 0.19 |
| Jul | 0.44 | 0.34 | -0.10 |
| Aug | 0.51 | 0.48 | -0.03 |
| Sep | 0.26 | 0.73 | 0.47 |
| Oct | 0.26 | 0.40 | 0.13 |
| Nov | 0.11 | 0.26 | 0.15 |
| Dec | 0.12 | 0.21 | 0.09 |
| ⌀ Month | 0.22 | 0.35 | 0.13 |