Climate Change Chart of Whistler Blackcomb, Canada
Comprehensive Climate Change Chart of Whistler Blackcomb, Canada: Monthly Averages and Impact Trends
Explore the changing climate in Whistler Blackcomb, Canada, through insightful data analysis.
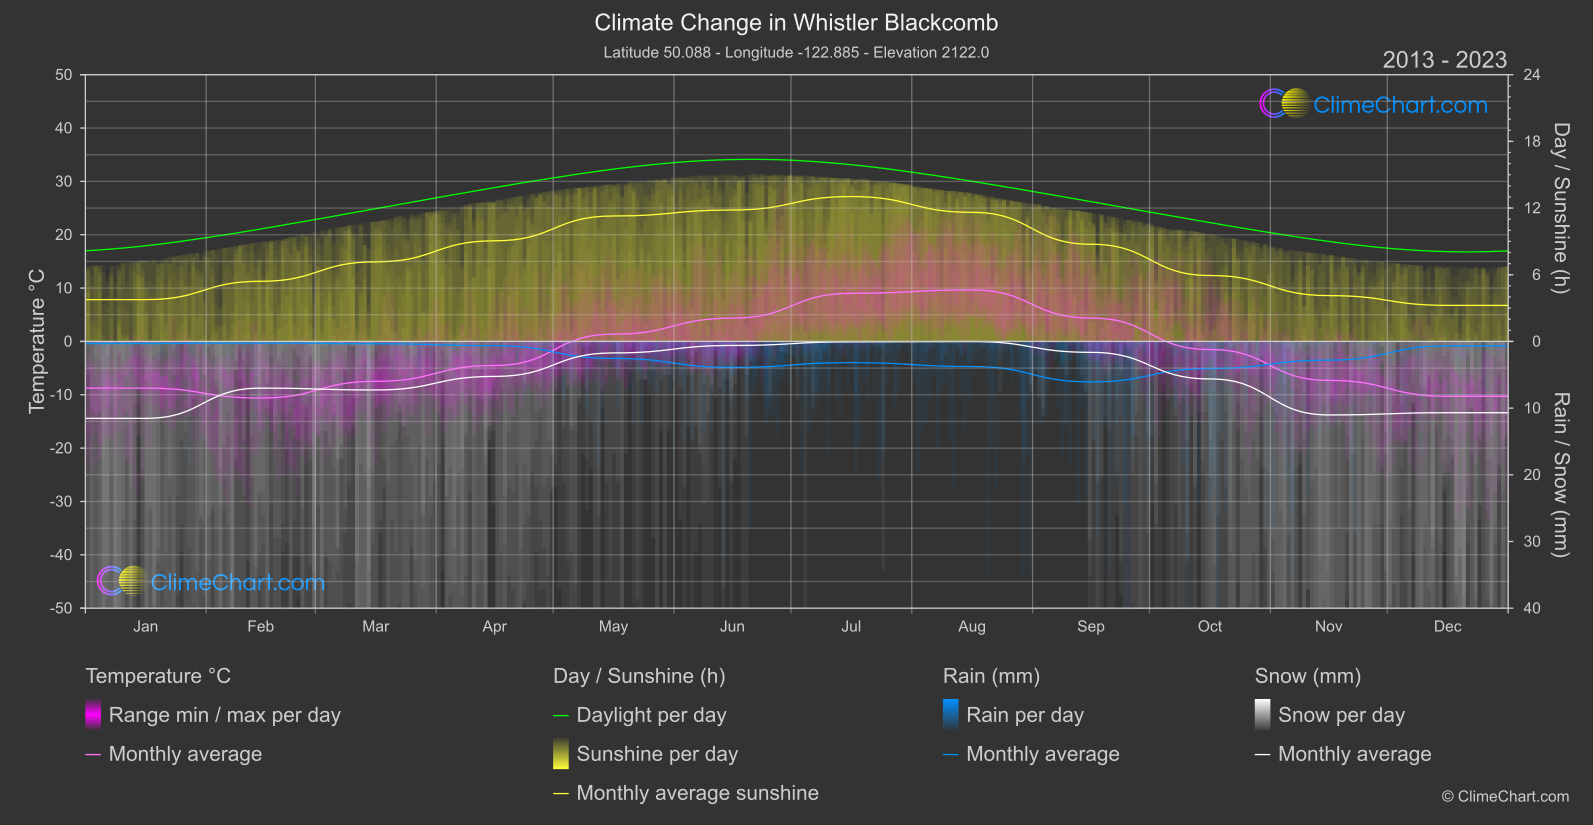
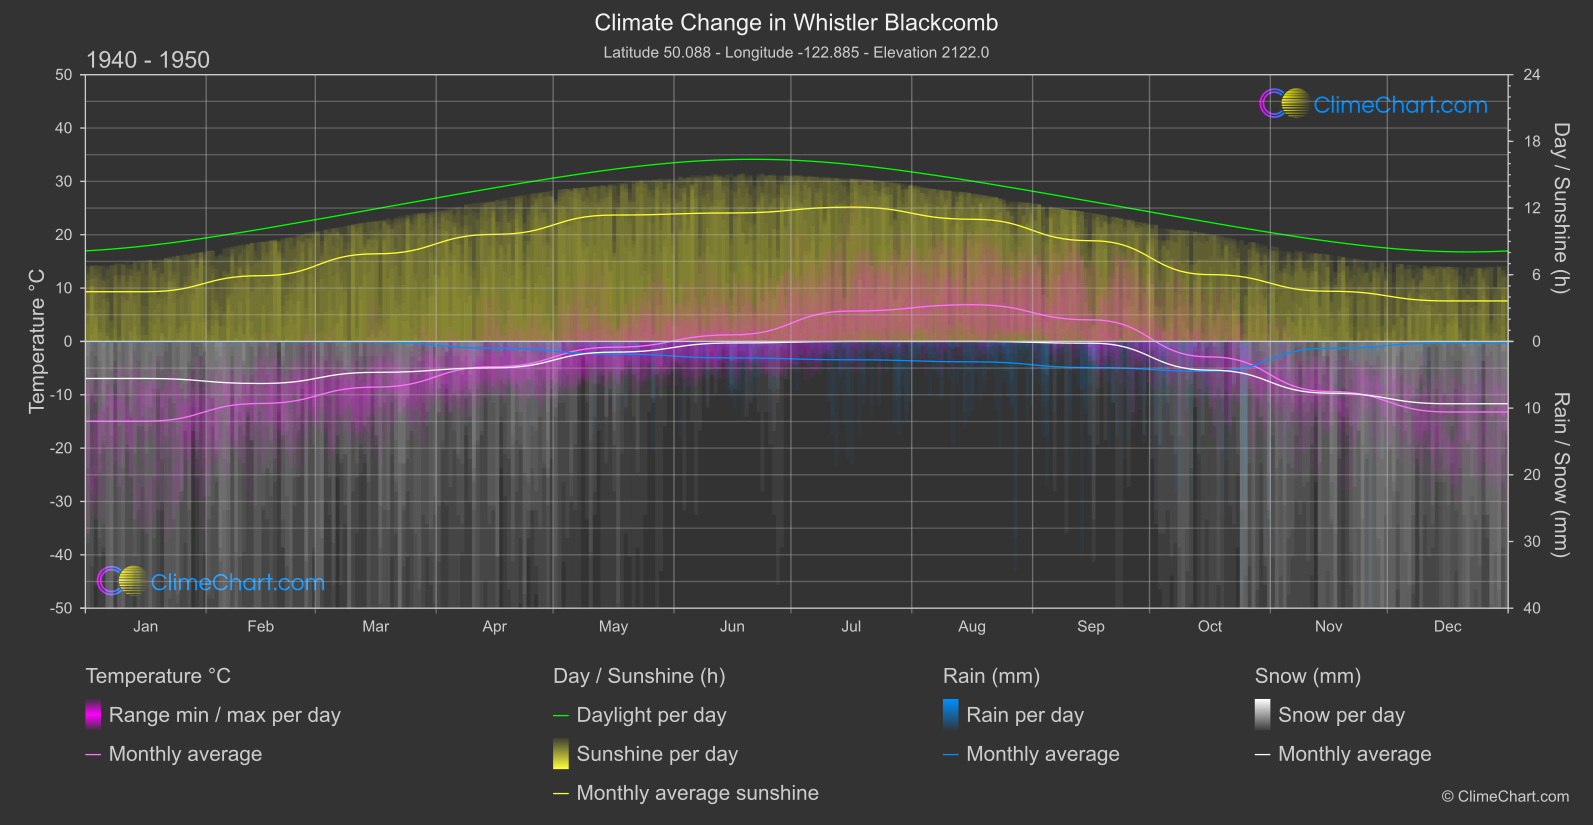
Whistler Blackcomb, Canada, has experienced significant changes in climate over the years. The data reveals interesting insights, such as the month with the highest temperature change or rainfall. From temperature fluctuations to snowfall variations, the climate patterns in Whistler Blackcomb paint a compelling picture of environmental shifts.
Climate Change Data Overview for Whistler Blackcomb, Canada
Explore the comprehensive climate change data for Whistler Blackcomb, Canada. This detailed table provides valuable insights into temperature variations, precipitation levels, and seasonal changes influenced by climate change, helping you understand the unique weather patterns of this region.
Temperature °C
| Month | ⌀ 1940 - 1950 | ⌀ 2013 - 2023 | +/- |
|---|---|---|---|
| Jan | -14.95 | -8.75 | 6.20 |
| Feb | -11.63 | -10.61 | 1.02 |
| Mar | -8.56 | -7.48 | 1.08 |
| Apr | -4.73 | -4.51 | 0.22 |
| May | -1.09 | 1.36 | 2.45 |
| Jun | 1.23 | 4.36 | 3.13 |
| Jul | 5.70 | 9.02 | 3.32 |
| Aug | 6.88 | 9.65 | 2.76 |
| Sep | 4.04 | 4.38 | 0.34 |
| Oct | -2.90 | -1.51 | 1.38 |
| Nov | -9.38 | -7.31 | 2.07 |
| Dec | -13.23 | -10.29 | 2.94 |
| ⌀ Month | -4.05 | -1.81 | 2.24 |
Sunshine (h)
| Month | ⌀ 1940 - 1950 | ⌀ 2013 - 2023 | +/- |
|---|---|---|---|
| Jan | 4.47 | 3.76 | -0.71 |
| Feb | 5.91 | 5.41 | -0.50 |
| Mar | 7.88 | 7.16 | -0.72 |
| Apr | 9.63 | 9.05 | -0.58 |
| May | 11.37 | 11.29 | -0.08 |
| Jun | 11.56 | 11.82 | 0.27 |
| Jul | 12.08 | 13.04 | 0.95 |
| Aug | 10.99 | 11.62 | 0.62 |
| Sep | 9.06 | 8.74 | -0.32 |
| Oct | 6.01 | 5.93 | -0.08 |
| Nov | 4.52 | 4.12 | -0.39 |
| Dec | 3.64 | 3.24 | -0.40 |
| ⌀ Month | 8.09 | 7.93 | -0.16 |
Rain (mm)
| Month | ⌀ 1940 - 1950 | ⌀ 2013 - 2023 | +/- |
|---|---|---|---|
| Jan | 0.02 | 0.15 | 0.13 |
| Feb | 0.02 | 0.12 | 0.10 |
| Mar | 0.05 | 0.17 | 0.13 |
| Apr | 0.51 | 0.32 | -0.19 |
| May | 0.95 | 1.27 | 0.33 |
| Jun | 1.24 | 1.95 | 0.71 |
| Jul | 1.38 | 1.59 | 0.21 |
| Aug | 1.53 | 1.88 | 0.35 |
| Sep | 1.96 | 3.03 | 1.07 |
| Oct | 2.24 | 2.03 | -0.21 |
| Nov | 0.50 | 1.40 | 0.90 |
| Dec | 0.12 | 0.34 | 0.22 |
| ⌀ Month | 0.88 | 1.19 | 0.31 |
Snow (mm)
| Month | ⌀ 1940 - 1950 | ⌀ 2013 - 2023 | +/- |
|---|---|---|---|
| Jan | 2.78 | 5.77 | 2.99 |
| Feb | 3.15 | 3.50 | 0.35 |
| Mar | 2.32 | 3.64 | 1.32 |
| Apr | 1.98 | 2.62 | 0.64 |
| May | 0.80 | 0.86 | 0.06 |
| Jun | 0.11 | 0.30 | 0.19 |
| Jul | 0.00 | 0.03 | 0.03 |
| Aug | 0.00 | 0.01 | 0.01 |
| Sep | 0.13 | 0.82 | 0.69 |
| Oct | 2.15 | 2.81 | 0.66 |
| Nov | 3.88 | 5.51 | 1.63 |
| Dec | 4.67 | 5.35 | 0.67 |
| ⌀ Month | 1.83 | 2.60 | 0.77 |