Climate Chart of Whitehorse, Canada
Comprehensive Climate Chart of Whitehorse, Canada: Monthly Averages and Weather Trends
Explore the Climate of Whitehorse, Canada
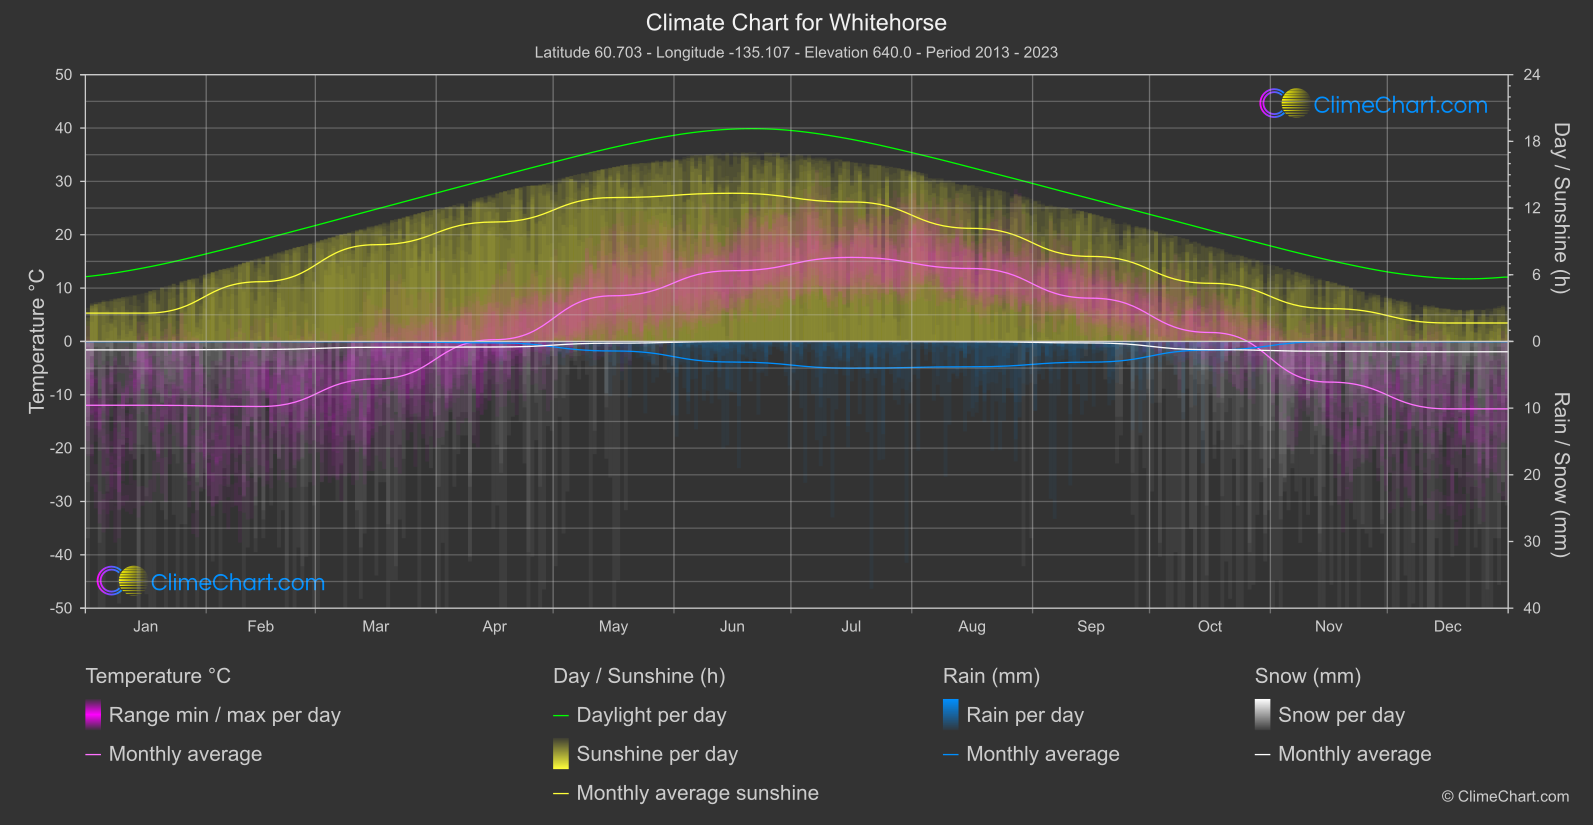
Whitehorse, the capital of Yukon in Canada, experiences a subarctic climate marked by long, cold winters and short, mild summers. The average temperature in January, the coldest month, is around -18°C, while in July, the warmest month, temperatures typically reach 19°C. The city receives moderate precipitation throughout the year, with snowfall common in the winter months. The unique climate of Whitehorse offers visitors a chance to experience the beauty of the northern wilderness in a pristine winter wonderland.
Best Travel Time Guide for Whitehorse, Canada: Ideal Seasons and Weather Insights
The best time to travel to Whitehorse, Canada, is during the summer months from June to August when the weather is milder, and outdoor activities are in full swing. Winter also offers a unique experience with opportunities for activities like dog sledding and viewing the mesmerizing Northern Lights. Plan your trip accordingly to make the most of what Whitehorse has to offer throughout the year.
Climate Data Overview for Whitehorse, Canada
Explore the comprehensive climate data for Whitehorse, Canada. This detailed table provides valuable insights into temperature variations, precipitation levels, and seasonal changes, helping you understand the unique weather patterns of this region.
| Month | ⌀ Temperature °C | ⌀ Rain (mm) | ⌀ Snow (mm) | ⌀ Sunshine (h) |
|---|---|---|---|---|
| Jan | -12.0 | 0.02 | 0.64 | 2.55 |
| Feb | -12.2 | 0.01 | 0.60 | 5.37 |
| Mar | -7.0 | 0.02 | 0.44 | 8.70 |
| Apr | 0.3 | 0.11 | 0.42 | 10.75 |
| May | 8.6 | 0.71 | 0.13 | 12.94 |
| Jun | 13.3 | 1.55 | 0.00 | 13.33 |
| Jul | 15.8 | 2.00 | 0.00 | 12.55 |
| Aug | 13.7 | 1.90 | 0.02 | 10.17 |
| Sep | 8.1 | 1.55 | 0.11 | 7.65 |
| Oct | 1.7 | 0.64 | 0.62 | 5.23 |
| Nov | -7.6 | 0.01 | 0.74 | 2.95 |
| Dec | -12.6 | 0.02 | 0.78 | 1.66 |
| ⌀ Month | 0.8 | 0.71 | 0.38 | 7.82 |