Climate Chart of Toronto, Canada
Comprehensive Climate Chart of Toronto, Canada: Monthly Averages and Weather Trends
Toronto, Canada Climate Overview
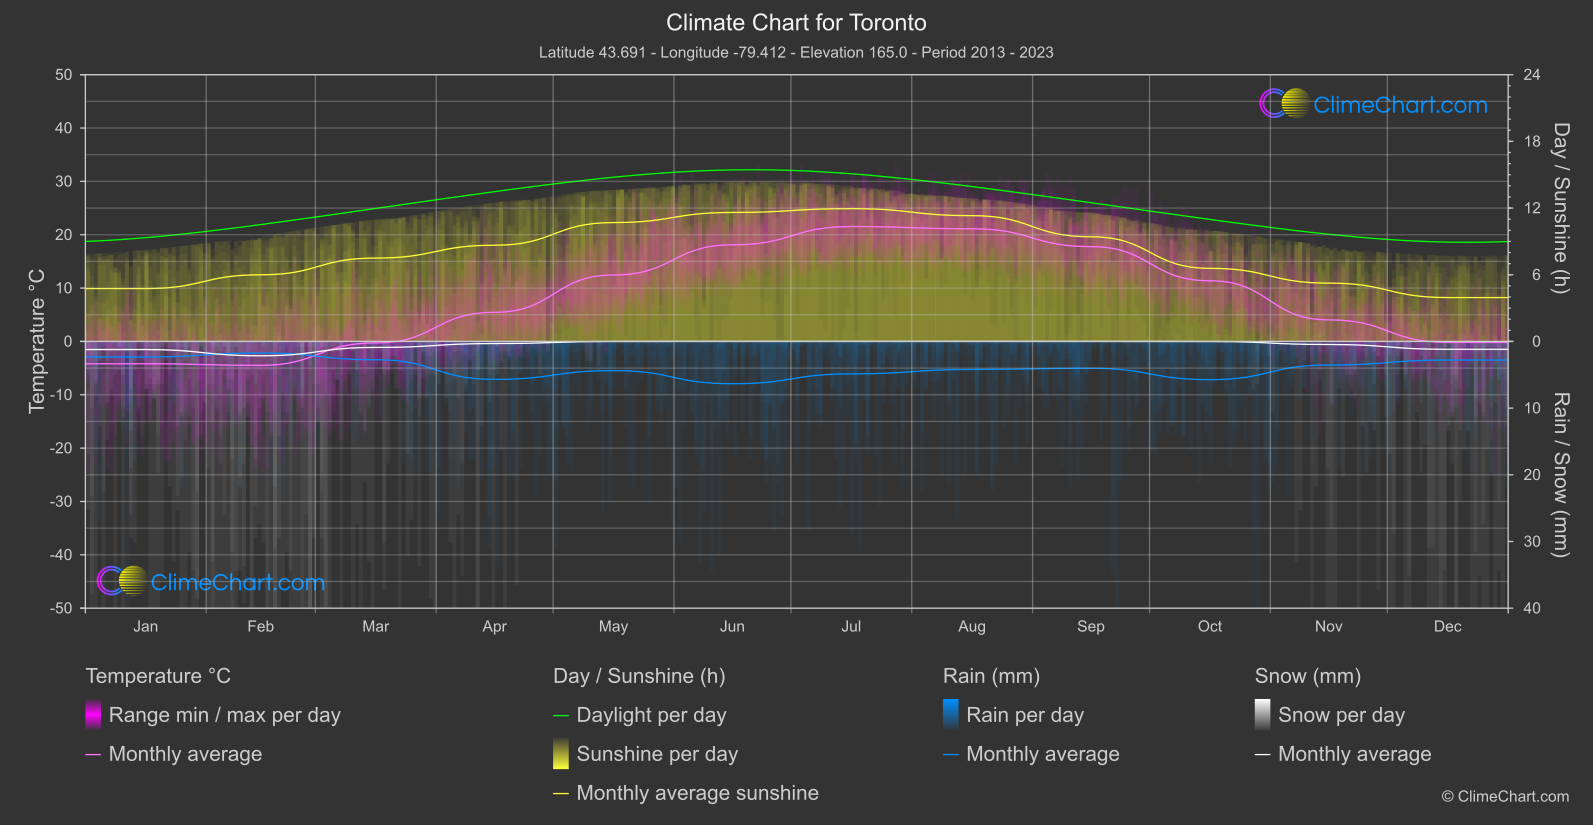
Toronto, located in Ontario, Canada, experiences a humid continental climate with warm summers and cold winters. The average annual temperature is around 7.8°C. Summers are typically mild to hot with temperatures averaging around 20-25°C, while winters are cold with temperatures often dropping below freezing, averaging around -6 to -1°C. Toronto receives moderate rainfall throughout the year, with the highest precipitation usually occurring in the summer months.
Best Travel Time Guide for Toronto, Canada: Ideal Seasons and Weather Insights
The best time to travel to Toronto is during the late spring and early fall when the weather is mild and comfortable. These seasons offer pleasant temperatures and fewer crowds compared to the peak summer months. It's also a great time to enjoy outdoor activities and explore the city's attractions.
Climate Data Overview for Toronto, Canada
Explore the comprehensive climate data for Toronto, Canada. This detailed table provides valuable insights into temperature variations, precipitation levels, and seasonal changes, helping you understand the unique weather patterns of this region.
| Month | ⌀ Temperature °C | ⌀ Rain (mm) | ⌀ Snow (mm) | ⌀ Sunshine (h) |
|---|---|---|---|---|
| Jan | -4.2 | 1.17 | 0.61 | 4.76 |
| Feb | -4.5 | 0.87 | 1.08 | 5.99 |
| Mar | -0.3 | 1.37 | 0.45 | 7.50 |
| Apr | 5.5 | 2.84 | 0.16 | 8.66 |
| May | 12.5 | 2.19 | 0.00 | 10.69 |
| Jun | 18.1 | 3.17 | 0.00 | 11.60 |
| Jul | 21.5 | 2.43 | 0.00 | 11.95 |
| Aug | 21.1 | 2.10 | 0.00 | 11.32 |
| Sep | 17.8 | 2.01 | 0.00 | 9.41 |
| Oct | 11.4 | 2.87 | 0.00 | 6.58 |
| Nov | 4.0 | 1.77 | 0.23 | 5.25 |
| Dec | -0.2 | 1.39 | 0.59 | 3.95 |
| ⌀ Month | 8.6 | 2.02 | 0.26 | 8.14 |