Climate Change Chart of Banff, Canada
Comprehensive Climate Change Chart of Banff, Canada: Monthly Averages and Impact Trends
Exploring the climate change data in Banff, Canada reveals fascinating insights into the changing weather patterns over the years.
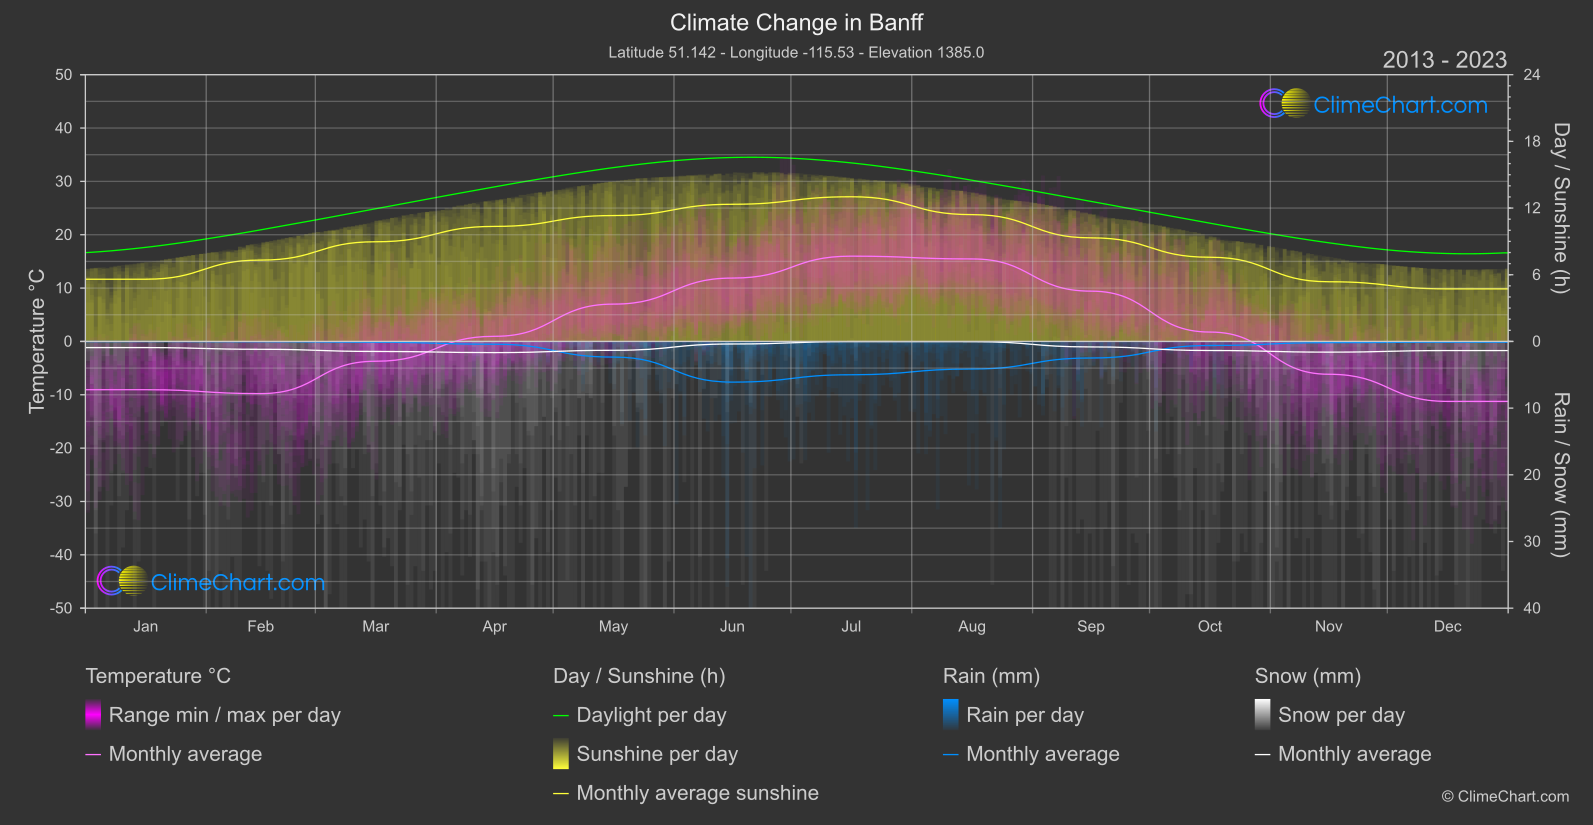
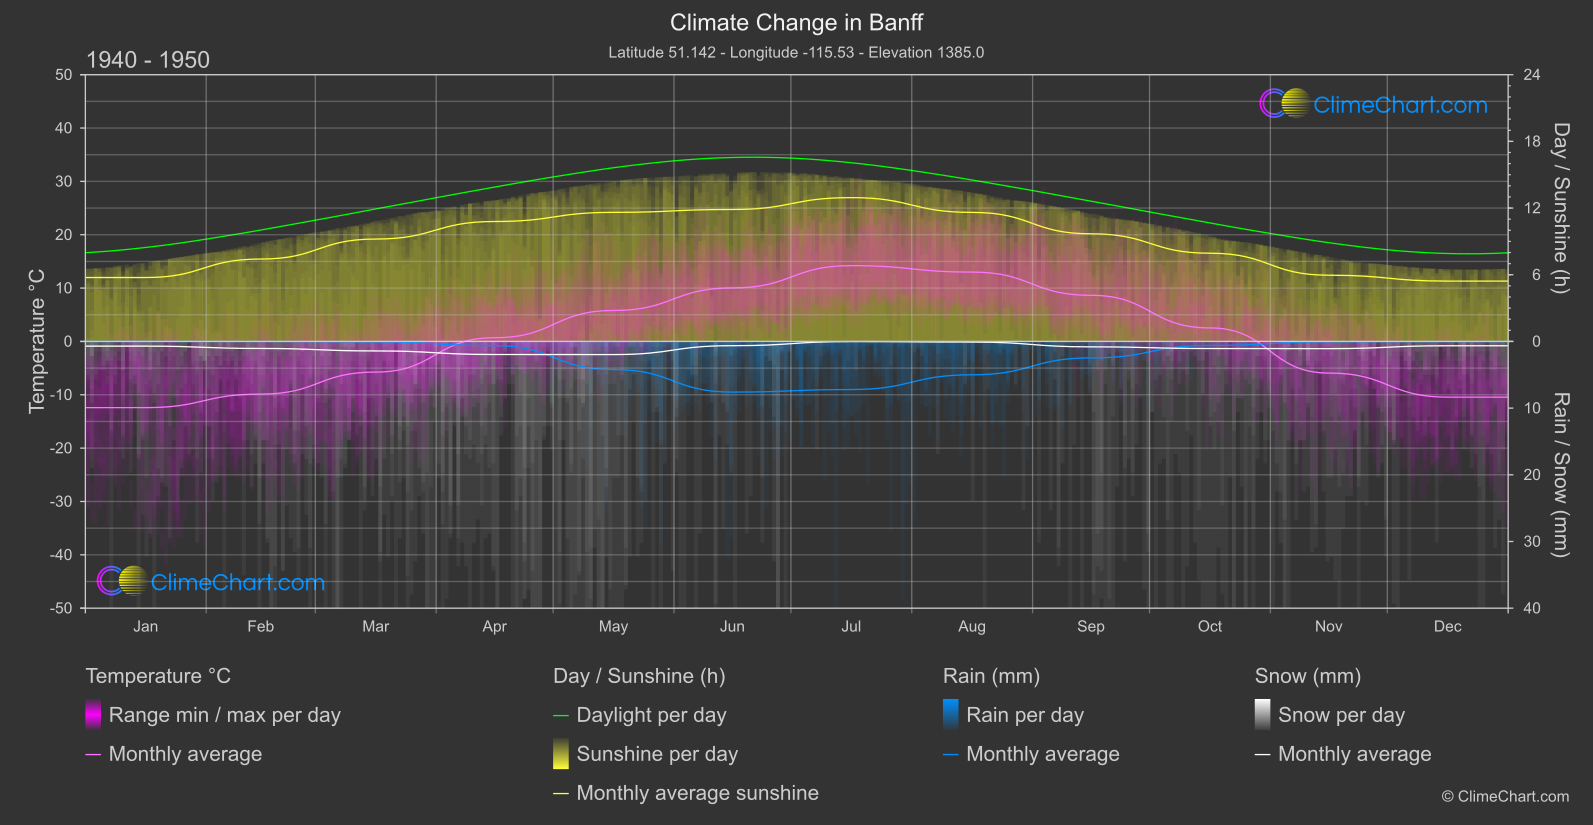
Banff, located in Canada, experiences climate change impacts reflected in temperature, rainfall, snowfall, and sunshine duration. Comparing data from 1940-1950 to 2013-2024, we observe significant temperature variations across months. For instance, the month of June shows a temperature increase of 1.85°C, while October experiences a decrease of 0.77°C. In terms of rainfall, May has a notable decrease of 0.94 mm, and July sees a decrease of 1.11 mm. Snowfall exhibits fluctuations with some months showing an increase and others a decrease. Sunshine duration also varies, with some months experiencing a decrease in hours of sunlight. Understanding these climate trends is crucial for sustainable planning and adaptation strategies.
Climate Change Data Overview for Banff, Canada
Explore the comprehensive climate change data for Banff, Canada. This detailed table provides valuable insights into temperature variations, precipitation levels, and seasonal changes influenced by climate change, helping you understand the unique weather patterns of this region.
Temperature °C
| Month | ⌀ 1940 - 1950 | ⌀ 2013 - 2023 | +/- |
|---|---|---|---|
| Jan | -12.41 | -9.05 | 3.36 |
| Feb | -9.87 | -9.78 | 0.09 |
| Mar | -5.74 | -3.71 | 2.03 |
| Apr | 0.70 | 0.96 | 0.26 |
| May | 5.80 | 7.00 | 1.20 |
| Jun | 10.03 | 11.88 | 1.85 |
| Jul | 14.21 | 15.98 | 1.78 |
| Aug | 13.00 | 15.46 | 2.46 |
| Sep | 8.64 | 9.43 | 0.78 |
| Oct | 2.53 | 1.76 | -0.77 |
| Nov | -5.93 | -6.15 | -0.23 |
| Dec | -10.45 | -11.24 | -0.79 |
| ⌀ Month | 0.88 | 1.88 | 1.00 |
Sunshine (h)
| Month | ⌀ 1940 - 1950 | ⌀ 2013 - 2023 | +/- |
|---|---|---|---|
| Jan | 5.75 | 5.60 | -0.15 |
| Feb | 7.41 | 7.32 | -0.09 |
| Mar | 9.21 | 8.97 | -0.24 |
| Apr | 10.79 | 10.35 | -0.44 |
| May | 11.61 | 11.33 | -0.29 |
| Jun | 11.87 | 12.34 | 0.47 |
| Jul | 12.94 | 13.02 | 0.08 |
| Aug | 11.61 | 11.41 | -0.20 |
| Sep | 9.68 | 9.32 | -0.36 |
| Oct | 7.94 | 7.57 | -0.36 |
| Nov | 5.96 | 5.37 | -0.59 |
| Dec | 5.43 | 4.73 | -0.70 |
| ⌀ Month | 9.18 | 8.94 | -0.24 |
Rain (mm)
| Month | ⌀ 1940 - 1950 | ⌀ 2013 - 2023 | +/- |
|---|---|---|---|
| Jan | 0.00 | 0.01 | 0.00 |
| Feb | 0.00 | 0.02 | 0.02 |
| Mar | 0.03 | 0.06 | 0.03 |
| Apr | 0.31 | 0.21 | -0.11 |
| May | 2.11 | 1.17 | -0.94 |
| Jun | 3.80 | 3.05 | -0.75 |
| Jul | 3.61 | 2.50 | -1.11 |
| Aug | 2.50 | 2.07 | -0.43 |
| Sep | 1.23 | 1.24 | 0.01 |
| Oct | 0.30 | 0.30 | 0.00 |
| Nov | 0.03 | 0.09 | 0.07 |
| Dec | 0.01 | 0.06 | 0.05 |
| ⌀ Month | 1.16 | 0.90 | -0.26 |
Snow (mm)
| Month | ⌀ 1940 - 1950 | ⌀ 2013 - 2023 | +/- |
|---|---|---|---|
| Jan | 0.35 | 0.46 | 0.11 |
| Feb | 0.53 | 0.59 | 0.06 |
| Mar | 0.71 | 0.75 | 0.04 |
| Apr | 0.98 | 0.84 | -0.14 |
| May | 0.98 | 0.66 | -0.32 |
| Jun | 0.32 | 0.19 | -0.13 |
| Jul | 0.01 | 0.01 | 0.00 |
| Aug | 0.05 | 0.02 | -0.03 |
| Sep | 0.41 | 0.41 | 0.00 |
| Oct | 0.53 | 0.68 | 0.15 |
| Nov | 0.54 | 0.80 | 0.26 |
| Dec | 0.32 | 0.68 | 0.36 |
| ⌀ Month | 0.48 | 0.51 | 0.03 |