Climate Comparison Chart of Rome, Italy vs Flying Fish Cove, Christmas Island
Comprehensive Climate Comparison Chart of Rome, Italy vs Flying Fish Cove, Christmas Island: Monthly Averages and Impact Trends
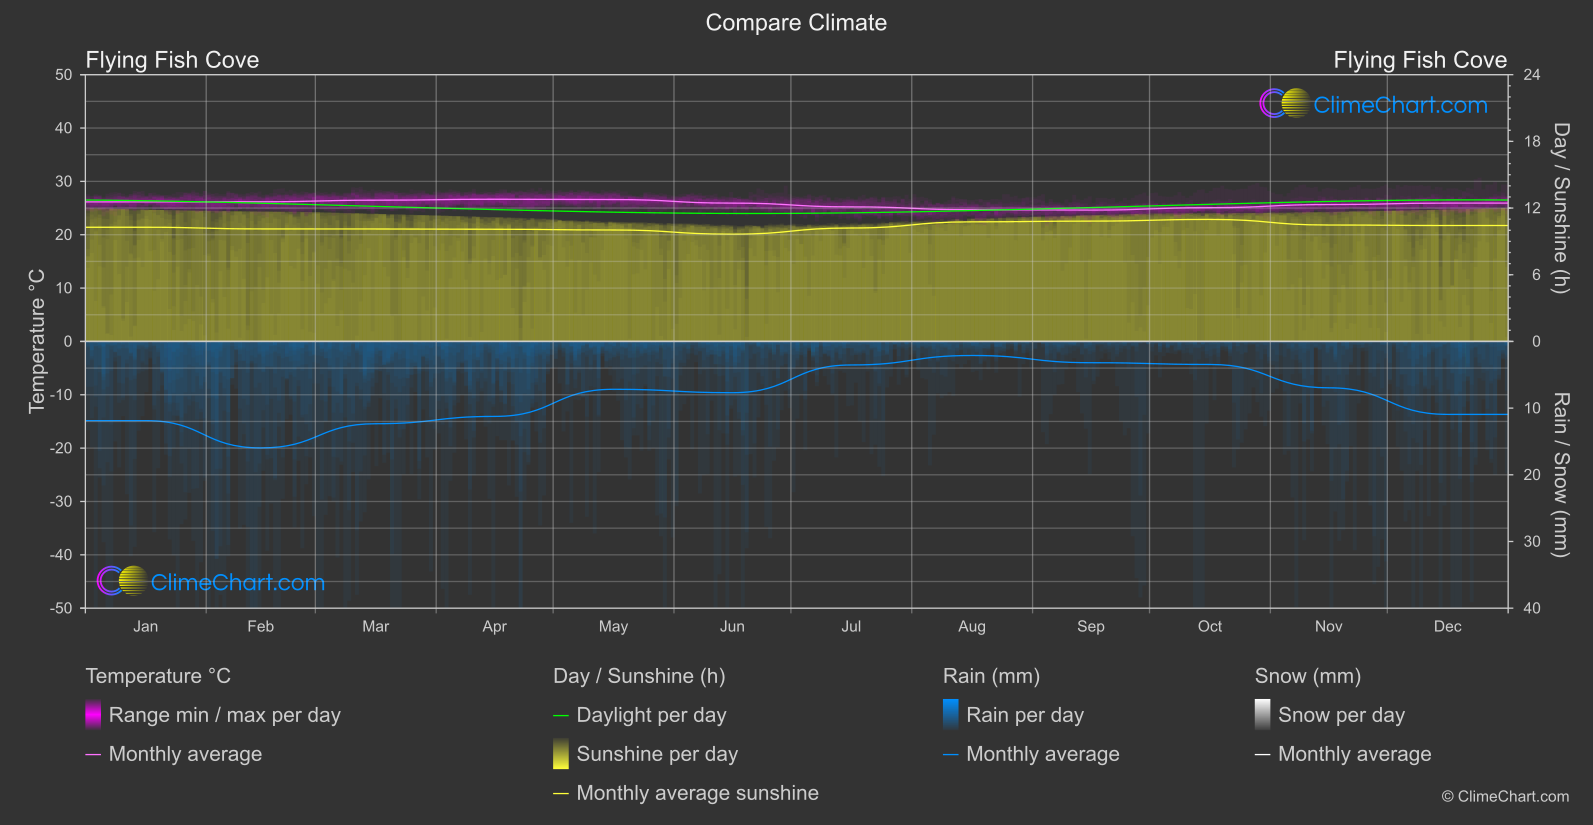
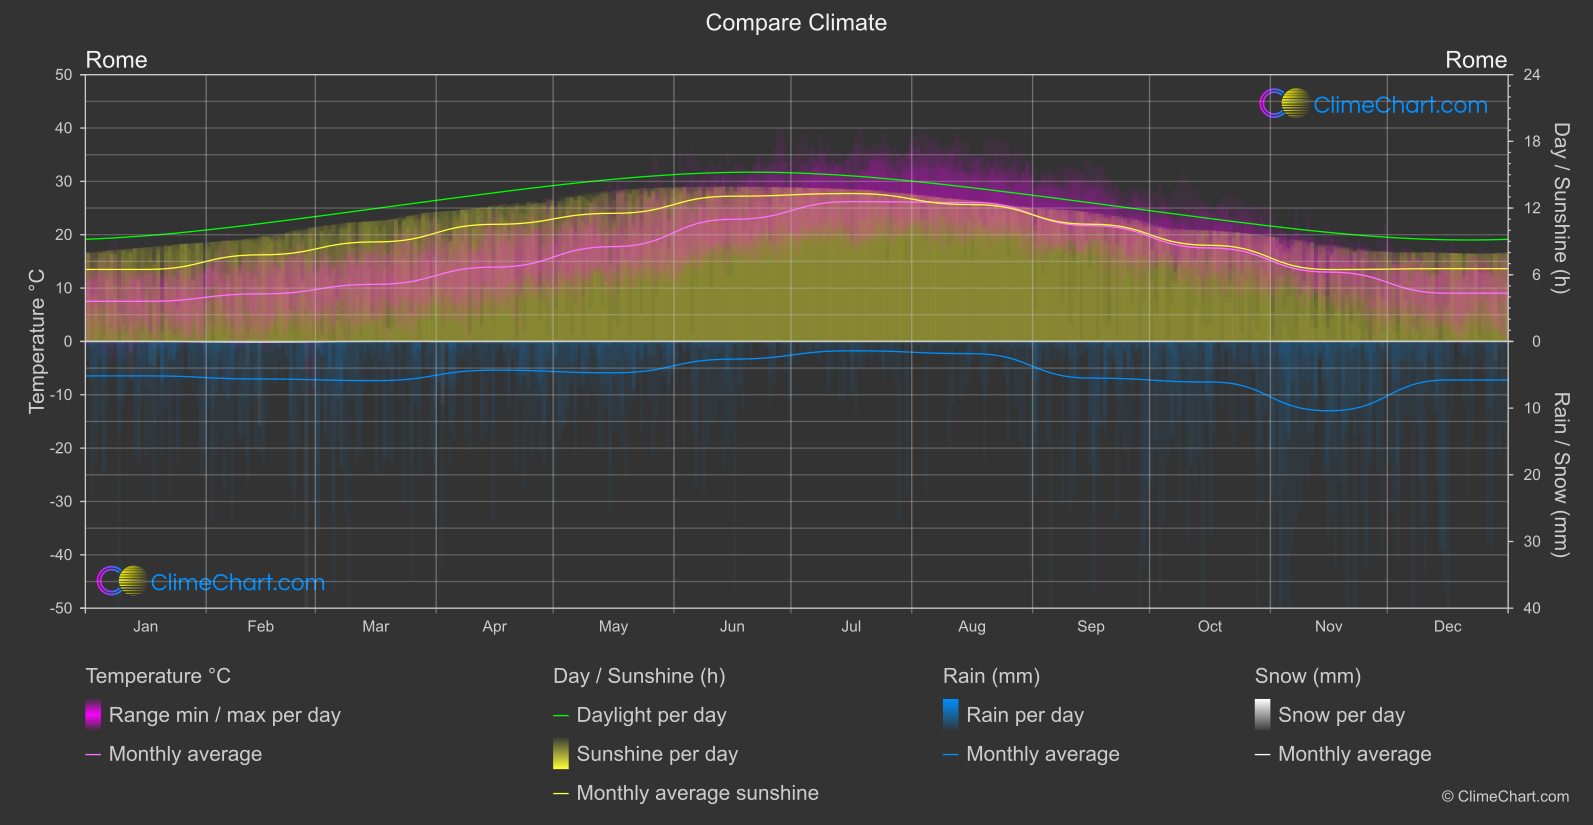
Welcome to our Climate Comparison Tool, where you can explore and compare the weather patterns of Rome, Italy and Flying Fish Cove, Christmas Island. Our comprehensive charts provide detailed insights into temperature variations, precipitation levels, and seasonal changes throughout the year. Whether you're planning a trip or just curious about the climate, our tool helps you understand the unique weather conditions of these locations. Discover the best time to visit Rome and Flying Fish Cove and make informed travel decisions based on accurate climate data.
Share this climate chart on
Share
Climate Comparison Data Overview for Rome, Italy vs Flying Fish Cove, Christmas Island
Explore the comprehensive climate comparison data for Rome, Italy and Flying Fish Cove, Christmas Island. This detailed table provides valuable insights into temperature variations, precipitation levels, and seasonal changes influenced by climate factors, helping you understand the unique weather patterns of these regions.
Temperature °C
| Month |
Rome |
Flying Fish Cove |
+/- |
| Jan |
7.52 |
26.15 |
18.63 |
| Feb |
8.91 |
26.18 |
17.26 |
| Mar |
10.70 |
26.48 |
15.77 |
| Apr |
13.93 |
26.65 |
12.72 |
| May |
17.78 |
26.60 |
8.82 |
| Jun |
22.89 |
25.93 |
3.03 |
| Jul |
26.21 |
25.22 |
-0.99 |
| Aug |
26.03 |
24.69 |
-1.34 |
| Sep |
21.70 |
24.62 |
2.92 |
| Oct |
17.51 |
25.07 |
7.56 |
| Nov |
12.99 |
25.66 |
12.66 |
| Dec |
9.04 |
25.93 |
16.89 |
| ⌀ Month |
16.27 |
25.76 |
9.50 |
Sunshine (h)
| Month |
Rome |
Flying Fish Cove |
+/- |
| Jan |
6.48 |
10.27 |
3.79 |
| Feb |
7.79 |
10.12 |
2.33 |
| Mar |
8.95 |
10.12 |
1.16 |
| Apr |
10.54 |
10.09 |
-0.44 |
| May |
11.53 |
10.03 |
-1.50 |
| Jun |
13.07 |
9.65 |
-3.42 |
| Jul |
13.31 |
10.21 |
-3.10 |
| Aug |
12.31 |
10.76 |
-1.55 |
| Sep |
10.54 |
10.83 |
0.28 |
| Oct |
8.65 |
10.98 |
2.33 |
| Nov |
6.47 |
10.47 |
4.01 |
| Dec |
6.54 |
10.43 |
3.88 |
| ⌀ Month |
9.68 |
10.33 |
0.65 |
Rain (mm)
| Month |
Rome |
Flying Fish Cove |
+/- |
| Jan |
2.58 |
5.94 |
3.36 |
| Feb |
2.82 |
7.98 |
5.17 |
| Mar |
2.94 |
6.17 |
3.23 |
| Apr |
2.16 |
5.62 |
3.46 |
| May |
2.35 |
3.59 |
1.23 |
| Jun |
1.33 |
3.84 |
2.52 |
| Jul |
0.70 |
1.76 |
1.06 |
| Aug |
0.92 |
1.05 |
0.14 |
| Sep |
2.75 |
1.60 |
-1.16 |
| Oct |
3.04 |
1.73 |
-1.31 |
| Nov |
5.20 |
3.48 |
-1.72 |
| Dec |
2.89 |
5.47 |
2.58 |
| ⌀ Month |
2.47 |
4.02 |
1.55 |
Snow (mm)
| Month |
Rome |
Flying Fish Cove |
+/- |
| Jan |
0.00 |
0.00 |
-0.00 |
| Feb |
0.05 |
0.00 |
-0.05 |
| Mar |
0.00 |
0.00 |
-0.00 |
| Apr |
0.00 |
0.00 |
-0.00 |
| May |
0.00 |
0.00 |
0.00 |
| Jun |
0.00 |
0.00 |
0.00 |
| Jul |
0.00 |
0.00 |
0.00 |
| Aug |
0.00 |
0.00 |
0.00 |
| Sep |
0.00 |
0.00 |
0.00 |
| Oct |
0.00 |
0.00 |
0.00 |
| Nov |
0.00 |
0.00 |
-0.00 |
| Dec |
0.00 |
0.00 |
-0.00 |
| ⌀ Month |
0.00 |
0.00 |
-0.00 |