Climate Change Chart of Mont Saint Michel, France
Comprehensive Climate Change Chart of Mont Saint Michel, France: Monthly Averages and Impact Trends
Explore the changing climate in Mont Saint Michel, France through insightful data analysis. Discover how temperature, rainfall, snowfall, and sunshine duration have evolved from 1940 to 1950 compared to 2013 to 2024.
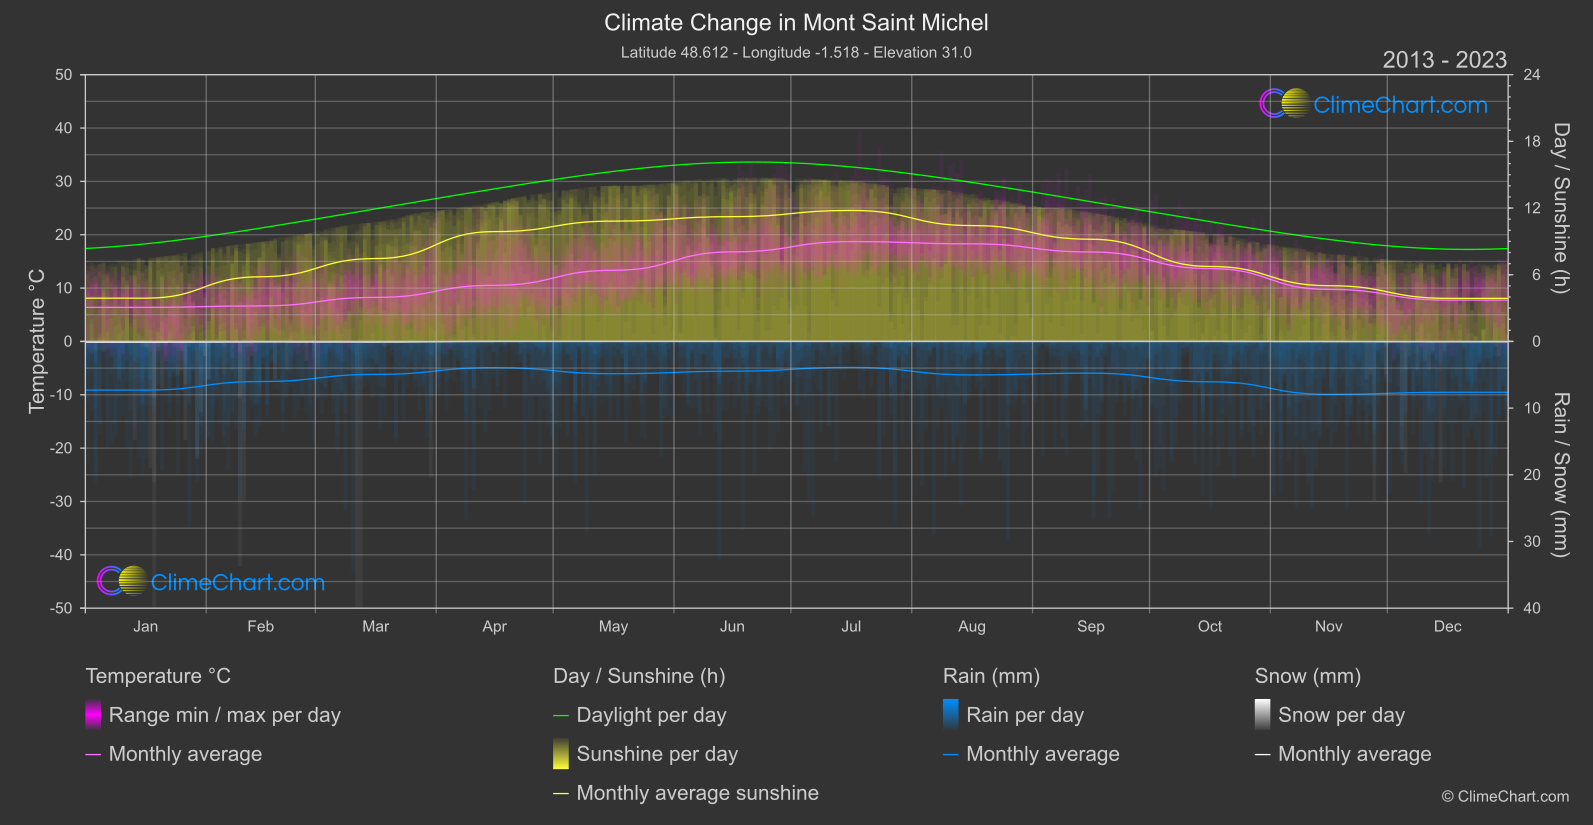
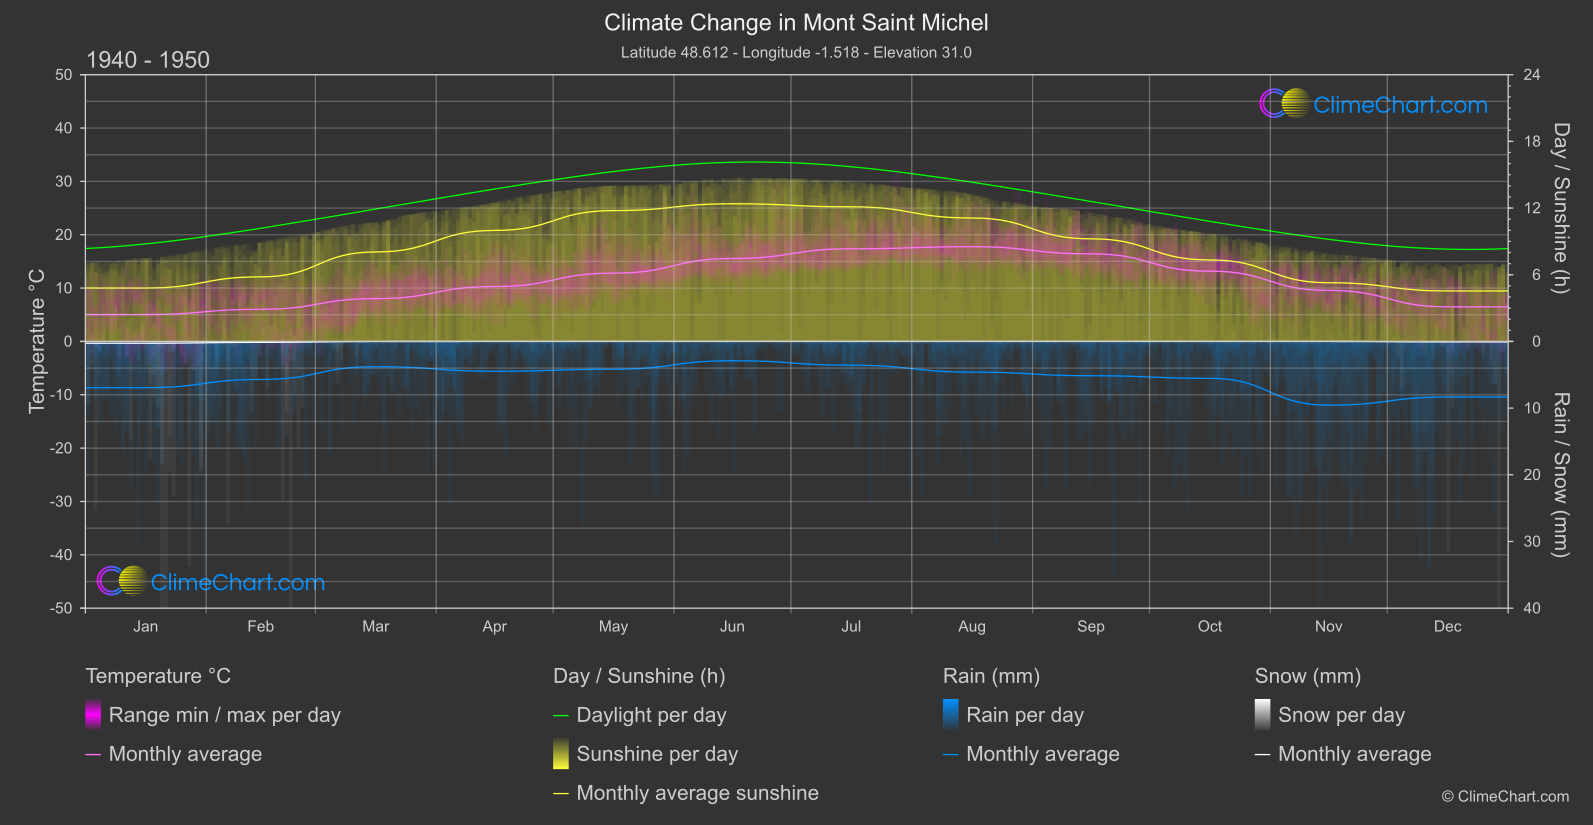
Mont Saint Michel in France has experienced significant climate changes over the years. Analyzing the temperature data reveals that June and July have seen the highest increase in temperature between the two periods studied. In terms of rainfall, March and June show the most substantial changes, with March experiencing a significant increase in rainfall. Snowfall has generally decreased over the years, with slight fluctuations in November and December. The sunshine duration has also decreased across most months, with June experiencing the most significant drop.
Climate Change Data Overview for Mont Saint Michel, France
Explore the comprehensive climate change data for Mont Saint Michel, France. This detailed table provides valuable insights into temperature variations, precipitation levels, and seasonal changes influenced by climate change, helping you understand the unique weather patterns of this region.
Temperature °C
| Month | ⌀ 1940 - 1950 | ⌀ 2013 - 2023 | +/- |
|---|---|---|---|
| Jan | 5.04 | 6.38 | 1.34 |
| Feb | 6.03 | 6.66 | 0.63 |
| Mar | 8.03 | 8.25 | 0.23 |
| Apr | 10.29 | 10.52 | 0.23 |
| May | 12.80 | 13.34 | 0.54 |
| Jun | 15.55 | 16.79 | 1.24 |
| Jul | 17.37 | 18.71 | 1.35 |
| Aug | 17.76 | 18.29 | 0.53 |
| Sep | 16.41 | 16.77 | 0.35 |
| Oct | 13.17 | 13.66 | 0.49 |
| Nov | 9.56 | 9.75 | 0.19 |
| Dec | 6.48 | 7.74 | 1.26 |
| ⌀ Month | 11.54 | 12.24 | 0.70 |
Sunshine (h)
| Month | ⌀ 1940 - 1950 | ⌀ 2013 - 2023 | +/- |
|---|---|---|---|
| Jan | 4.80 | 3.89 | -0.91 |
| Feb | 5.81 | 5.82 | 0.01 |
| Mar | 8.05 | 7.46 | -0.59 |
| Apr | 9.99 | 9.88 | -0.11 |
| May | 11.77 | 10.83 | -0.95 |
| Jun | 12.38 | 11.23 | -1.16 |
| Jul | 12.11 | 11.79 | -0.33 |
| Aug | 11.10 | 10.42 | -0.68 |
| Sep | 9.23 | 9.19 | -0.04 |
| Oct | 7.33 | 6.75 | -0.59 |
| Nov | 5.28 | 5.01 | -0.27 |
| Dec | 4.54 | 3.88 | -0.67 |
| ⌀ Month | 8.53 | 8.01 | -0.52 |
Rain (mm)
| Month | ⌀ 1940 - 1950 | ⌀ 2013 - 2023 | +/- |
|---|---|---|---|
| Jan | 3.47 | 3.65 | 0.18 |
| Feb | 2.85 | 3.01 | 0.15 |
| Mar | 1.89 | 2.47 | 0.58 |
| Apr | 2.24 | 1.97 | -0.27 |
| May | 2.08 | 2.42 | 0.34 |
| Jun | 1.45 | 2.23 | 0.78 |
| Jul | 1.78 | 1.95 | 0.17 |
| Aug | 2.30 | 2.51 | 0.21 |
| Sep | 2.57 | 2.38 | -0.19 |
| Oct | 2.77 | 3.03 | 0.26 |
| Nov | 4.78 | 3.97 | -0.81 |
| Dec | 4.17 | 3.81 | -0.35 |
| ⌀ Month | 2.70 | 2.78 | 0.09 |
Snow (mm)
| Month | ⌀ 1940 - 1950 | ⌀ 2013 - 2023 | +/- |
|---|---|---|---|
| Jan | 0.13 | 0.06 | -0.08 |
| Feb | 0.07 | 0.03 | -0.03 |
| Mar | 0.00 | 0.04 | 0.04 |
| Apr | 0.00 | 0.00 | 0.00 |
| May | 0.00 | 0.00 | 0.00 |
| Jun | 0.00 | 0.00 | 0.00 |
| Jul | 0.00 | 0.00 | 0.00 |
| Aug | 0.00 | 0.00 | 0.00 |
| Sep | 0.00 | 0.00 | 0.00 |
| Oct | 0.00 | 0.00 | 0.00 |
| Nov | 0.00 | 0.01 | 0.01 |
| Dec | 0.04 | 0.02 | -0.01 |
| ⌀ Month | 0.02 | 0.01 | -0.01 |