Climate Change Chart of Chiang Rai, Thailand
Comprehensive Climate Change Chart of Chiang Rai, Thailand: Monthly Averages and Impact Trends
Exploring the changing climate in Chiang Rai, Thailand reveals intriguing patterns in temperature, rainfall, and sunshine duration over the years.
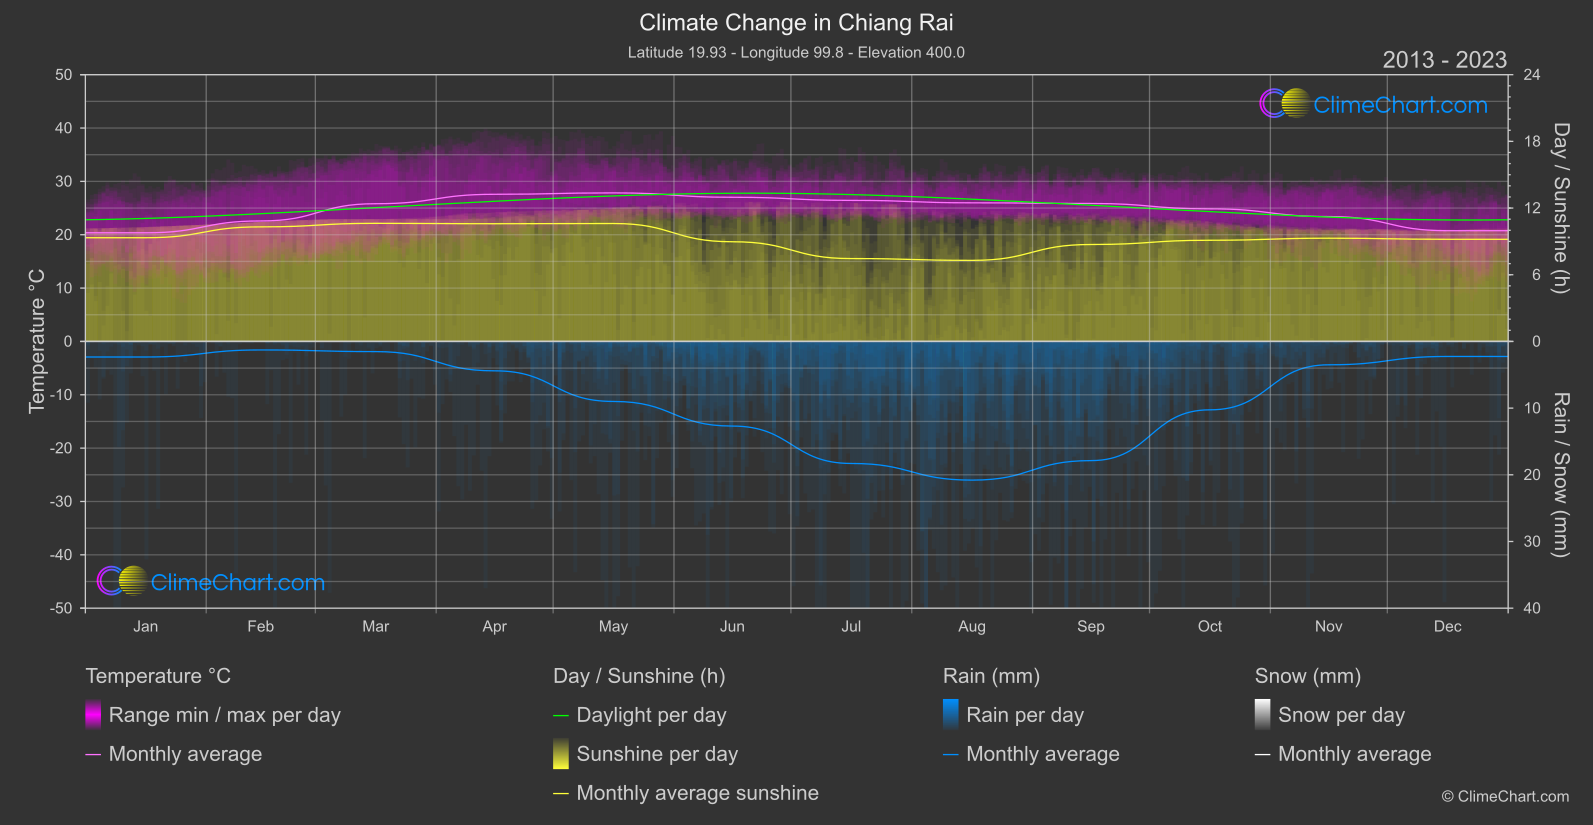
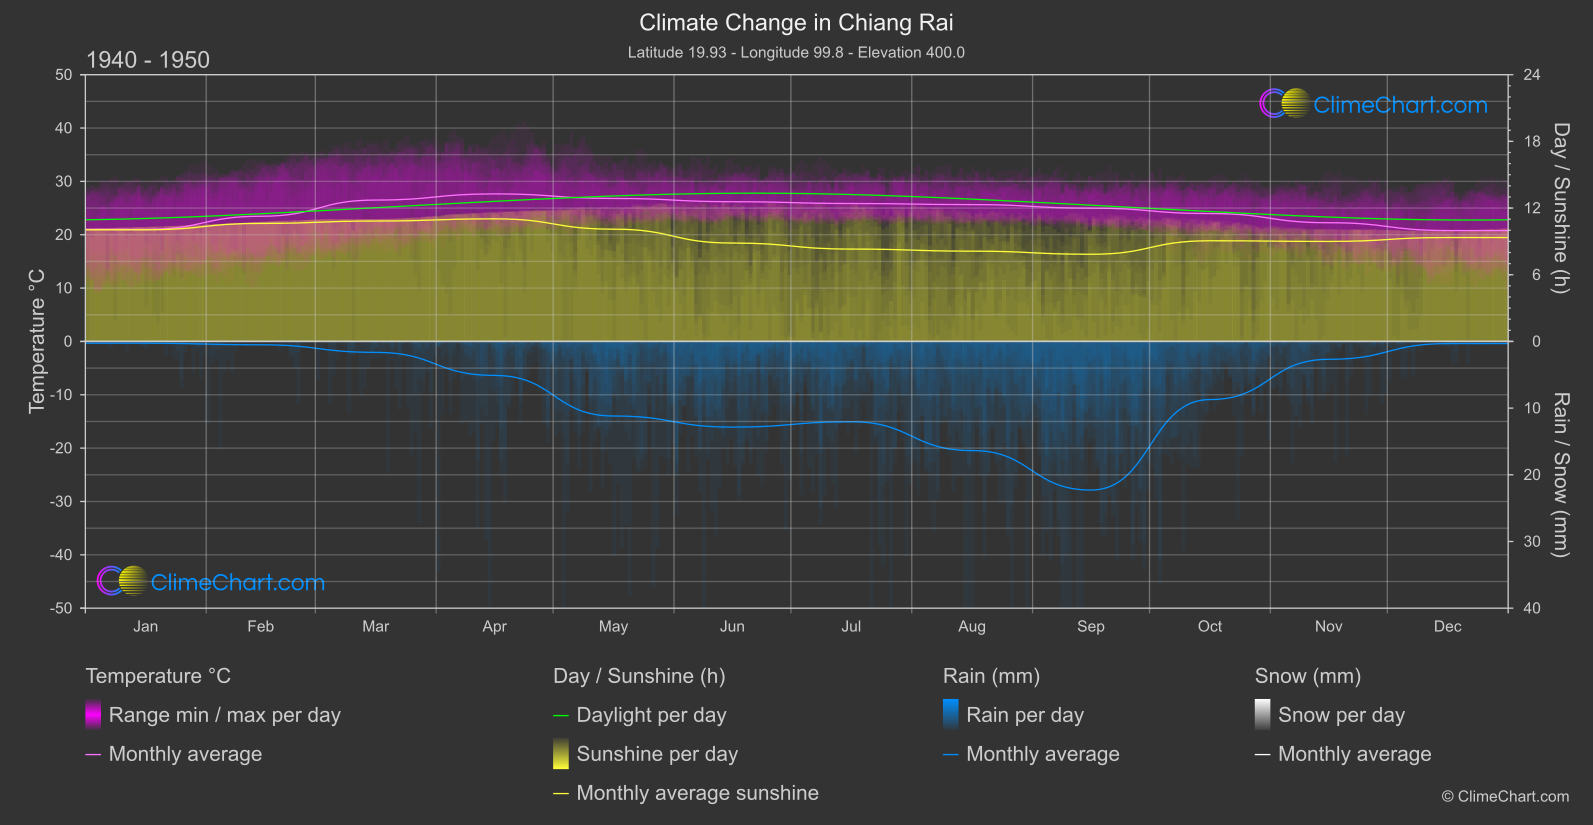
Chiang Rai, Thailand, has experienced notable changes in climate over the years. From 1940 to 1950 compared to 2013 to 2024, there have been fluctuations in temperature, rainfall, and sunshine duration. The data reveals interesting insights, such as the month with the highest temperature change or rainfall variance. Understanding these trends is crucial for assessing the impact of climate change in the region.
Climate Change Data Overview for Chiang Rai, Thailand
Explore the comprehensive climate change data for Chiang Rai, Thailand. This detailed table provides valuable insights into temperature variations, precipitation levels, and seasonal changes influenced by climate change, helping you understand the unique weather patterns of this region.
Temperature °C
| Month | ⌀ 1940 - 1950 | ⌀ 2013 - 2023 | +/- |
|---|---|---|---|
| Jan | 21.00 | 20.36 | -0.64 |
| Feb | 23.46 | 22.58 | -0.88 |
| Mar | 26.50 | 25.81 | -0.69 |
| Apr | 27.65 | 27.58 | -0.07 |
| May | 26.80 | 27.84 | 1.04 |
| Jun | 26.19 | 27.02 | 0.83 |
| Jul | 25.85 | 26.44 | 0.59 |
| Aug | 25.65 | 25.98 | 0.33 |
| Sep | 24.98 | 25.86 | 0.88 |
| Oct | 23.97 | 24.85 | 0.89 |
| Nov | 22.25 | 23.41 | 1.16 |
| Dec | 20.78 | 20.75 | -0.03 |
| ⌀ Month | 24.59 | 24.87 | 0.28 |
Sunshine (h)
| Month | ⌀ 1940 - 1950 | ⌀ 2013 - 2023 | +/- |
|---|---|---|---|
| Jan | 10.04 | 9.33 | -0.71 |
| Feb | 10.62 | 10.31 | -0.31 |
| Mar | 10.83 | 10.63 | -0.21 |
| Apr | 11.03 | 10.59 | -0.44 |
| May | 10.10 | 10.61 | 0.51 |
| Jun | 8.85 | 8.97 | 0.12 |
| Jul | 8.31 | 7.46 | -0.85 |
| Aug | 8.12 | 7.29 | -0.83 |
| Sep | 7.84 | 8.72 | 0.88 |
| Oct | 9.06 | 9.10 | 0.05 |
| Nov | 9.00 | 9.29 | 0.29 |
| Dec | 9.35 | 9.19 | -0.16 |
| ⌀ Month | 9.43 | 9.29 | -0.14 |
Rain (mm)
| Month | ⌀ 1940 - 1950 | ⌀ 2013 - 2023 | +/- |
|---|---|---|---|
| Jan | 0.14 | 1.17 | 1.03 |
| Feb | 0.25 | 0.64 | 0.39 |
| Mar | 0.82 | 0.76 | -0.06 |
| Apr | 2.55 | 2.20 | -0.35 |
| May | 5.59 | 4.50 | -1.09 |
| Jun | 6.42 | 6.35 | -0.08 |
| Jul | 6.02 | 9.15 | 3.13 |
| Aug | 8.18 | 10.40 | 2.22 |
| Sep | 11.14 | 8.94 | -2.21 |
| Oct | 4.36 | 5.13 | 0.77 |
| Nov | 1.34 | 1.75 | 0.41 |
| Dec | 0.16 | 1.13 | 0.97 |
| ⌀ Month | 3.91 | 4.34 | 0.43 |
Snow (mm)
| Month | ⌀ 1940 - 1950 | ⌀ 2013 - 2023 | +/- |
|---|---|---|---|
| Jan | 0.00 | 0.00 | 0.00 |
| Feb | 0.00 | 0.00 | 0.00 |
| Mar | 0.00 | 0.00 | 0.00 |
| Apr | 0.00 | 0.00 | 0.00 |
| May | 0.00 | 0.00 | 0.00 |
| Jun | 0.00 | 0.00 | 0.00 |
| Jul | 0.00 | 0.00 | 0.00 |
| Aug | 0.00 | 0.00 | 0.00 |
| Sep | 0.00 | 0.00 | 0.00 |
| Oct | 0.00 | 0.00 | 0.00 |
| Nov | 0.00 | 0.00 | 0.00 |
| Dec | 0.00 | 0.00 | 0.00 |
| ⌀ Month | 0.00 | 0.00 | 0.00 |