Climate Chart of Chiang Rai, Thailand
Comprehensive Climate Chart of Chiang Rai, Thailand: Monthly Averages and Weather Trends
Discover the climate of Chiang Rai, Thailand
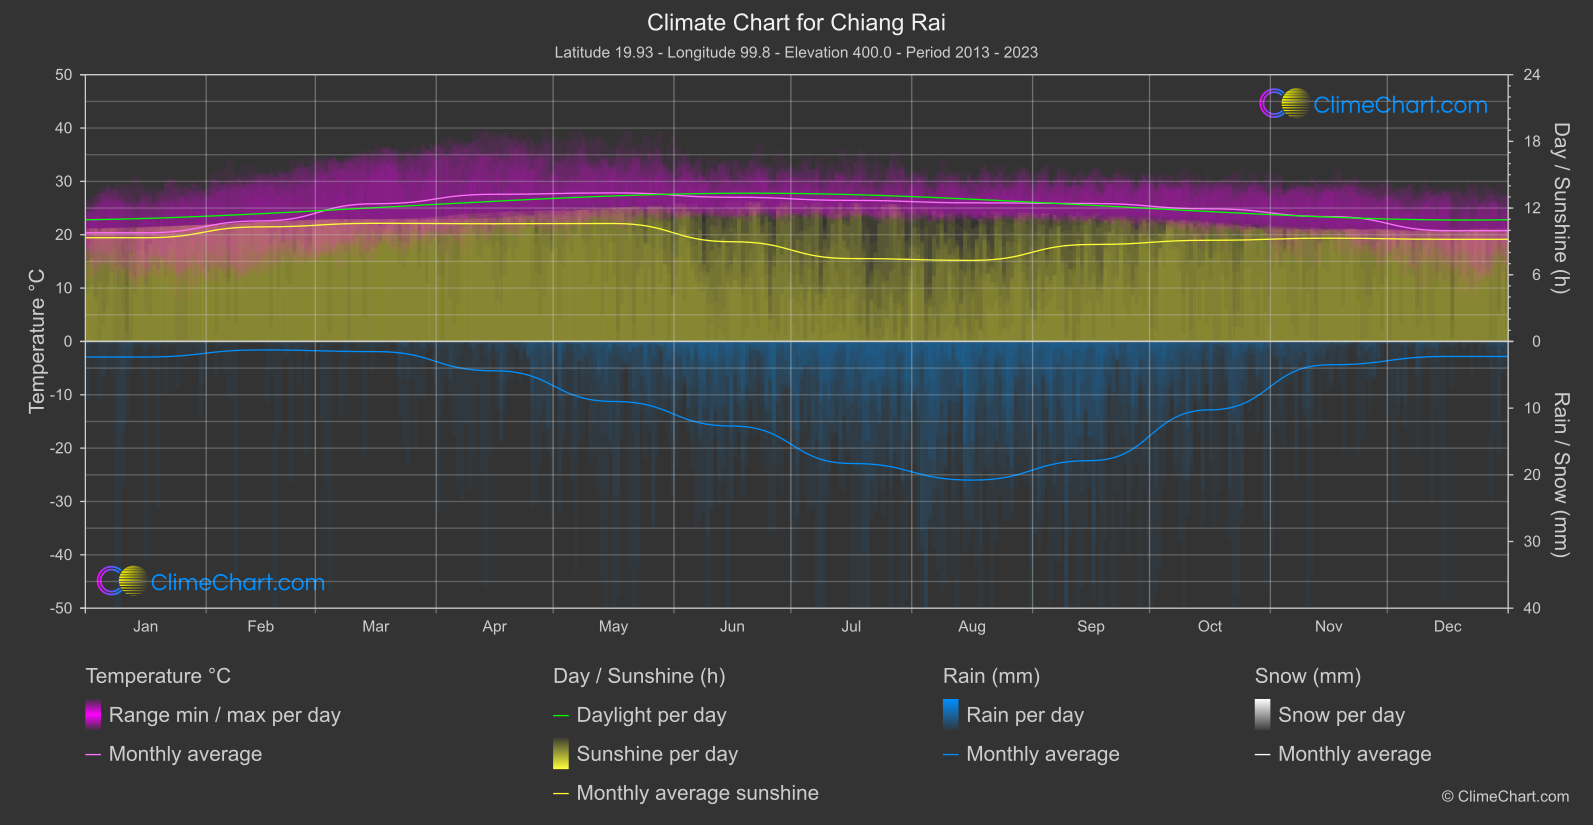
Chiang Rai, located in northern Thailand, experiences a tropical climate with three main seasons: hot season, rainy season, and cool season. The hot season usually lasts from March to May, with temperatures soaring above 30°C. The rainy season, from June to October, brings heavy downpours and high humidity. The cool season, from November to February, offers pleasant temperatures and clear skies, making it the most popular time to visit Chiang Rai.
Best Travel Time Guide for Chiang Rai, Thailand: Ideal Seasons and Weather Insights
The best time to travel to Chiang Rai is during the cool season, from November to February, when the weather is most pleasant and suitable for exploring the city's attractions.
Climate Data Overview for Chiang Rai, Thailand
Explore the comprehensive climate data for Chiang Rai, Thailand. This detailed table provides valuable insights into temperature variations, precipitation levels, and seasonal changes, helping you understand the unique weather patterns of this region.
| Month | ⌀ Temperature °C | ⌀ Rain (mm) | ⌀ Snow (mm) | ⌀ Sunshine (h) |
|---|---|---|---|---|
| Jan | 20.4 | 1.17 | 0.00 | 9.33 |
| Feb | 22.6 | 0.64 | 0.00 | 10.31 |
| Mar | 25.8 | 0.76 | 0.00 | 10.63 |
| Apr | 27.6 | 2.20 | 0.00 | 10.59 |
| May | 27.8 | 4.50 | 0.00 | 10.61 |
| Jun | 27.0 | 6.35 | 0.00 | 8.97 |
| Jul | 26.4 | 9.15 | 0.00 | 7.46 |
| Aug | 26.0 | 10.40 | 0.00 | 7.29 |
| Sep | 25.9 | 8.94 | 0.00 | 8.72 |
| Oct | 24.9 | 5.13 | 0.00 | 9.10 |
| Nov | 23.4 | 1.75 | 0.00 | 9.29 |
| Dec | 20.8 | 1.13 | 0.00 | 9.19 |
| ⌀ Month | 24.9 | 4.34 | 0.00 | 9.29 |