Climate Chart of Turin, Italy
Comprehensive Climate Chart of Turin, Italy: Monthly Averages and Weather Trends
Welcome to Turin, Italy! Discover the climate and weather patterns of this beautiful city.
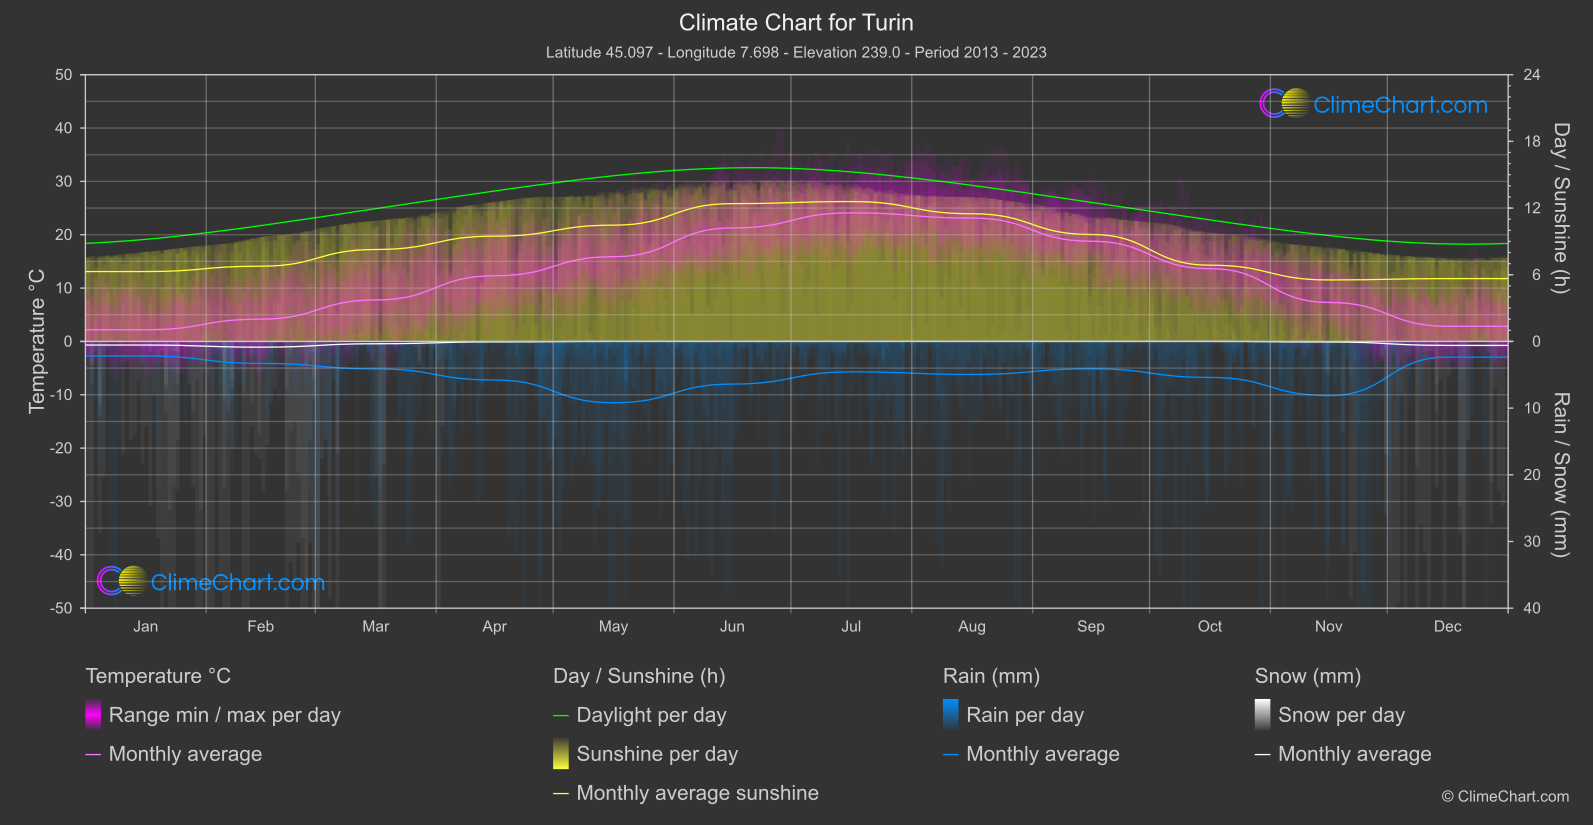
Turin, located in northern Italy, experiences a humid subtropical climate with hot summers and cold winters. The city sees precipitation throughout the year, with July being the wettest month. Winter temperatures can drop below freezing, while summer temperatures can reach the high 20s to low 30s Celsius.
Best Travel Time Guide for Turin, Italy: Ideal Seasons and Weather Insights
The best time to visit Turin is during the spring and autumn months when the weather is pleasant, and the city is less crowded with tourists. Spring (April to June) and autumn (September to October) offer mild temperatures and beautiful scenery, making it ideal for exploring the city's charm.
Climate Data Overview for Turin, Italy
Explore the comprehensive climate data for Turin, Italy. This detailed table provides valuable insights into temperature variations, precipitation levels, and seasonal changes, helping you understand the unique weather patterns of this region.
| Month | ⌀ Temperature °C | ⌀ Rain (mm) | ⌀ Snow (mm) | ⌀ Sunshine (h) |
|---|---|---|---|---|
| Jan | 2.2 | 1.09 | 0.27 | 6.29 |
| Feb | 4.2 | 1.64 | 0.43 | 6.77 |
| Mar | 7.8 | 2.06 | 0.17 | 8.27 |
| Apr | 12.3 | 2.89 | 0.03 | 9.47 |
| May | 15.9 | 4.60 | 0.00 | 10.46 |
| Jun | 21.3 | 3.20 | 0.00 | 12.40 |
| Jul | 24.1 | 2.28 | 0.00 | 12.59 |
| Aug | 23.1 | 2.48 | 0.00 | 11.49 |
| Sep | 18.8 | 2.05 | 0.00 | 9.62 |
| Oct | 13.6 | 2.70 | 0.00 | 6.86 |
| Nov | 7.3 | 4.06 | 0.04 | 5.53 |
| Dec | 2.8 | 1.17 | 0.30 | 5.65 |
| ⌀ Month | 12.8 | 2.52 | 0.10 | 8.78 |