Climate Change Chart of Turin, Italy
Comprehensive Climate Change Chart of Turin, Italy: Monthly Averages and Impact Trends
Explore the changing climate in Turin, Italy, with insights from temperature, rainfall, snowfall, and sunshine duration data.
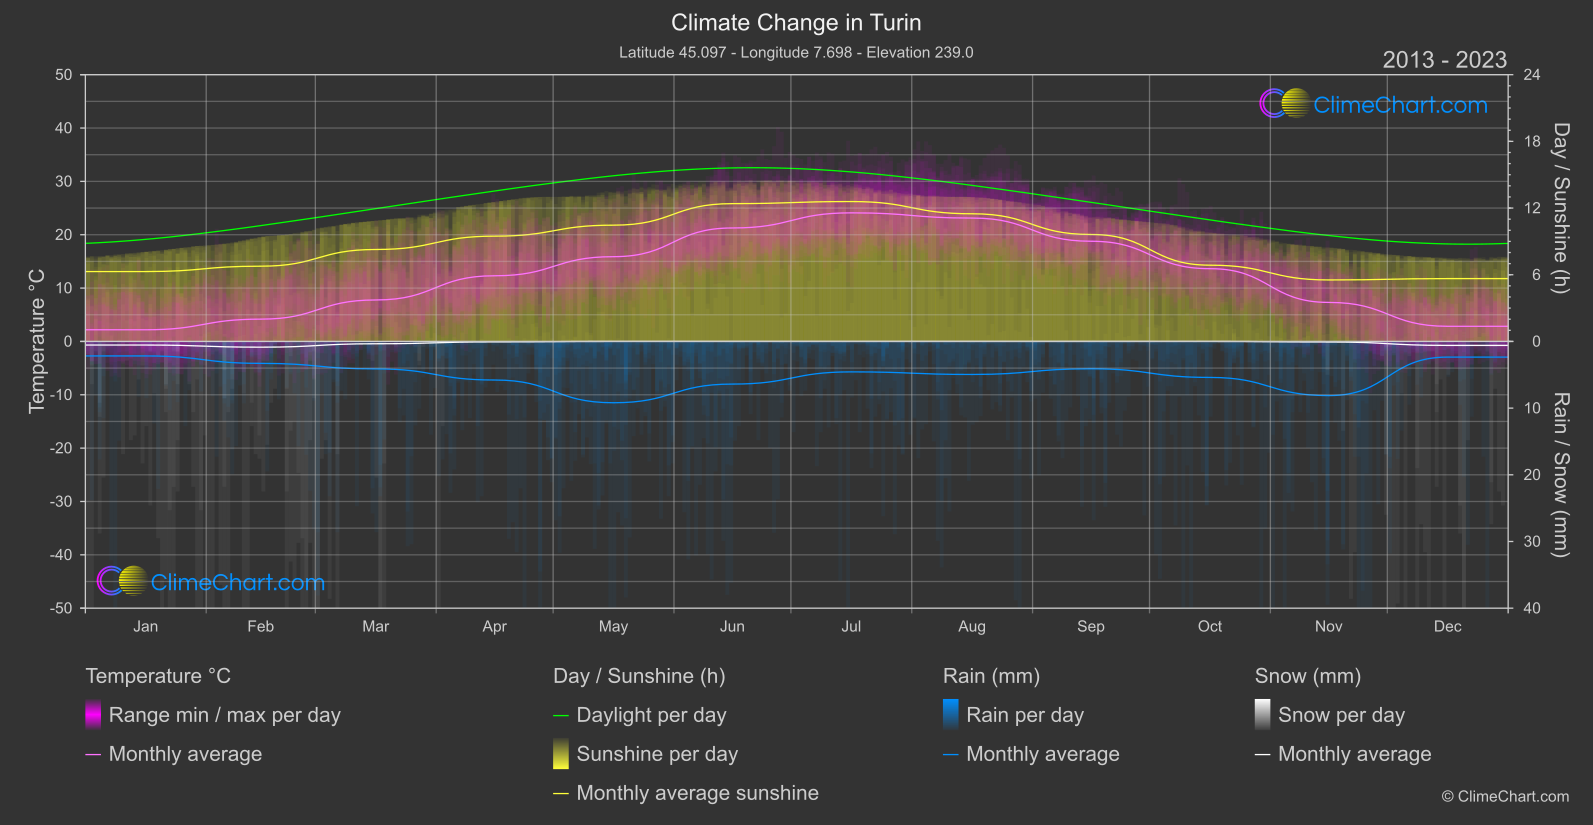
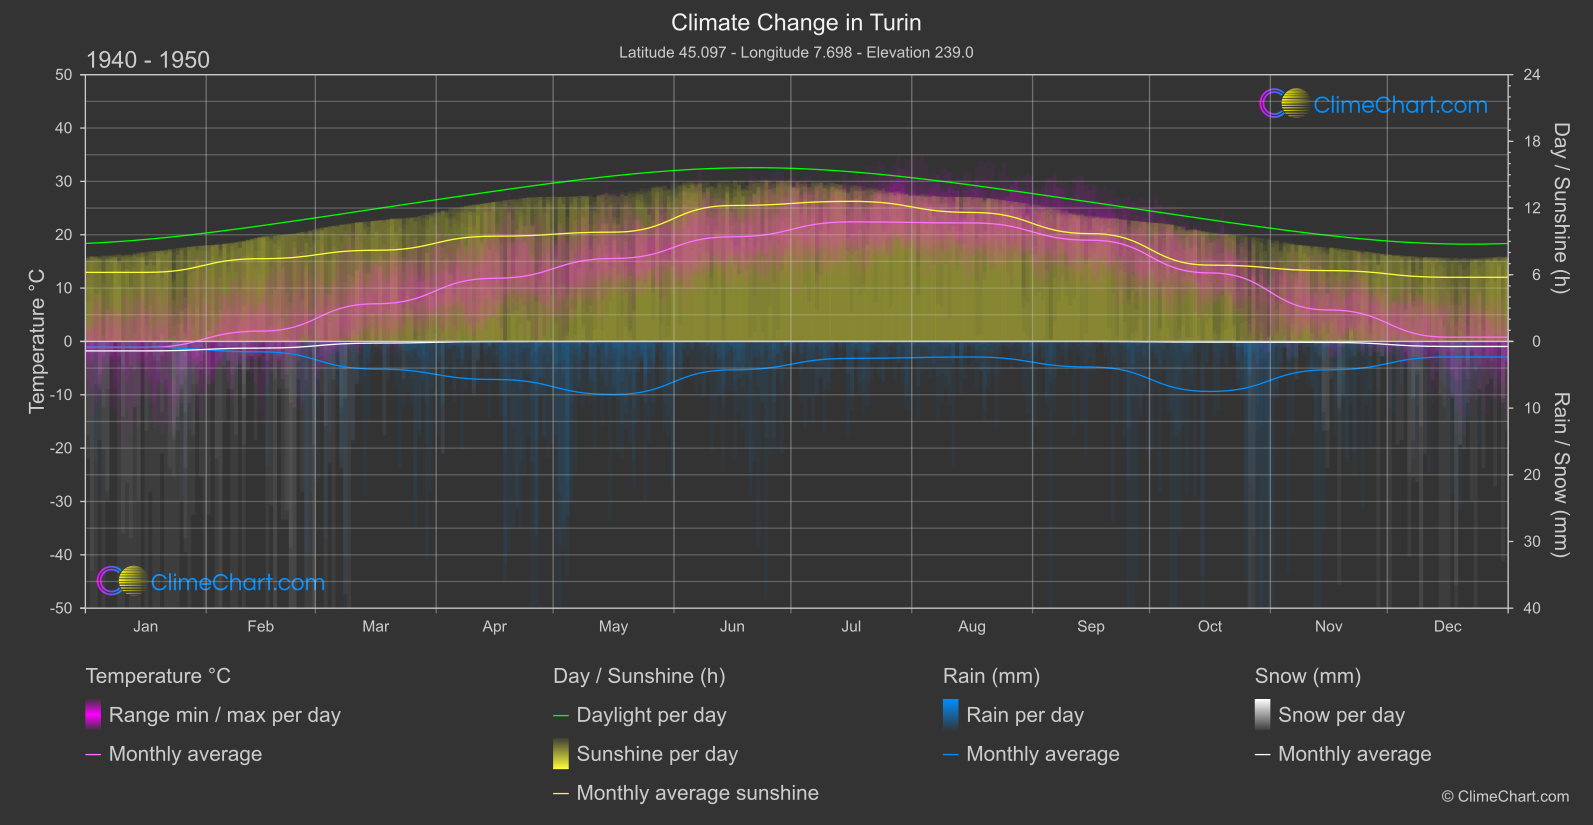
Turin, Italy, has experienced significant changes in climate over the years. The data shows varying trends in temperature, rainfall, snowfall, and sunshine duration. Among the findings, the month of June stands out with a noticeable temperature increase of 1.64°C compared to the 1940s. Additionally, the data highlights a considerable rise in rainfall in October, with a change of 1.94 mm. Snowfall has generally decreased over the years, especially in December, showing a significant decline of 0.08 mm. Sunshine duration has also shown fluctuations, with a decrease in November by 0.84 hours compared to the mid-20th century.
Climate Change Data Overview for Turin, Italy
Explore the comprehensive climate change data for Turin, Italy. This detailed table provides valuable insights into temperature variations, precipitation levels, and seasonal changes influenced by climate change, helping you understand the unique weather patterns of this region.
Temperature °C
| Month | ⌀ 1940 - 1950 | ⌀ 2013 - 2023 | +/- |
|---|---|---|---|
| Jan | -1.12 | 2.18 | 3.31 |
| Feb | 1.94 | 4.18 | 2.24 |
| Mar | 7.06 | 7.77 | 0.71 |
| Apr | 11.84 | 12.31 | 0.47 |
| May | 15.55 | 15.89 | 0.34 |
| Jun | 19.62 | 21.27 | 1.64 |
| Jul | 22.41 | 24.10 | 1.70 |
| Aug | 22.21 | 23.12 | 0.92 |
| Sep | 18.97 | 18.78 | -0.19 |
| Oct | 12.84 | 13.64 | 0.80 |
| Nov | 5.90 | 7.31 | 1.42 |
| Dec | 0.80 | 2.84 | 2.04 |
| ⌀ Month | 11.50 | 12.78 | 1.28 |
Sunshine (h)
| Month | ⌀ 1940 - 1950 | ⌀ 2013 - 2023 | +/- |
|---|---|---|---|
| Jan | 6.21 | 6.29 | 0.07 |
| Feb | 7.44 | 6.77 | -0.67 |
| Mar | 8.20 | 8.27 | 0.07 |
| Apr | 9.47 | 9.47 | 0.00 |
| May | 9.83 | 10.46 | 0.63 |
| Jun | 12.23 | 12.40 | 0.17 |
| Jul | 12.60 | 12.59 | -0.02 |
| Aug | 11.61 | 11.49 | -0.12 |
| Sep | 9.70 | 9.62 | -0.07 |
| Oct | 6.87 | 6.86 | -0.01 |
| Nov | 6.37 | 5.53 | -0.84 |
| Dec | 5.77 | 5.65 | -0.12 |
| ⌀ Month | 8.86 | 8.78 | -0.08 |
Rain (mm)
| Month | ⌀ 1940 - 1950 | ⌀ 2013 - 2023 | +/- |
|---|---|---|---|
| Jan | 0.44 | 1.09 | 0.65 |
| Feb | 0.78 | 1.64 | 0.86 |
| Mar | 2.07 | 2.06 | -0.01 |
| Apr | 2.85 | 2.89 | 0.04 |
| May | 3.98 | 4.60 | 0.62 |
| Jun | 2.13 | 3.20 | 1.07 |
| Jul | 1.27 | 2.28 | 1.01 |
| Aug | 1.17 | 2.48 | 1.31 |
| Sep | 1.92 | 2.05 | 0.13 |
| Oct | 3.75 | 2.70 | -1.05 |
| Nov | 2.13 | 4.06 | 1.94 |
| Dec | 1.16 | 1.17 | 0.01 |
| ⌀ Month | 1.97 | 2.52 | 0.55 |
Snow (mm)
| Month | ⌀ 1940 - 1950 | ⌀ 2013 - 2023 | +/- |
|---|---|---|---|
| Jan | 0.71 | 0.27 | -0.44 |
| Feb | 0.50 | 0.43 | -0.07 |
| Mar | 0.12 | 0.17 | 0.05 |
| Apr | 0.01 | 0.03 | 0.03 |
| May | 0.00 | 0.00 | 0.00 |
| Jun | 0.00 | 0.00 | 0.00 |
| Jul | 0.00 | 0.00 | 0.00 |
| Aug | 0.00 | 0.00 | 0.00 |
| Sep | 0.00 | 0.00 | 0.00 |
| Oct | 0.05 | 0.00 | -0.05 |
| Nov | 0.07 | 0.04 | -0.03 |
| Dec | 0.38 | 0.30 | -0.08 |
| ⌀ Month | 0.15 | 0.10 | -0.05 |