Climate Chart of Playa del Carmen, Mexico
Comprehensive Climate Chart of Playa del Carmen, Mexico: Monthly Averages and Weather Trends
Discover the climate of Playa del Carmen, Mexico
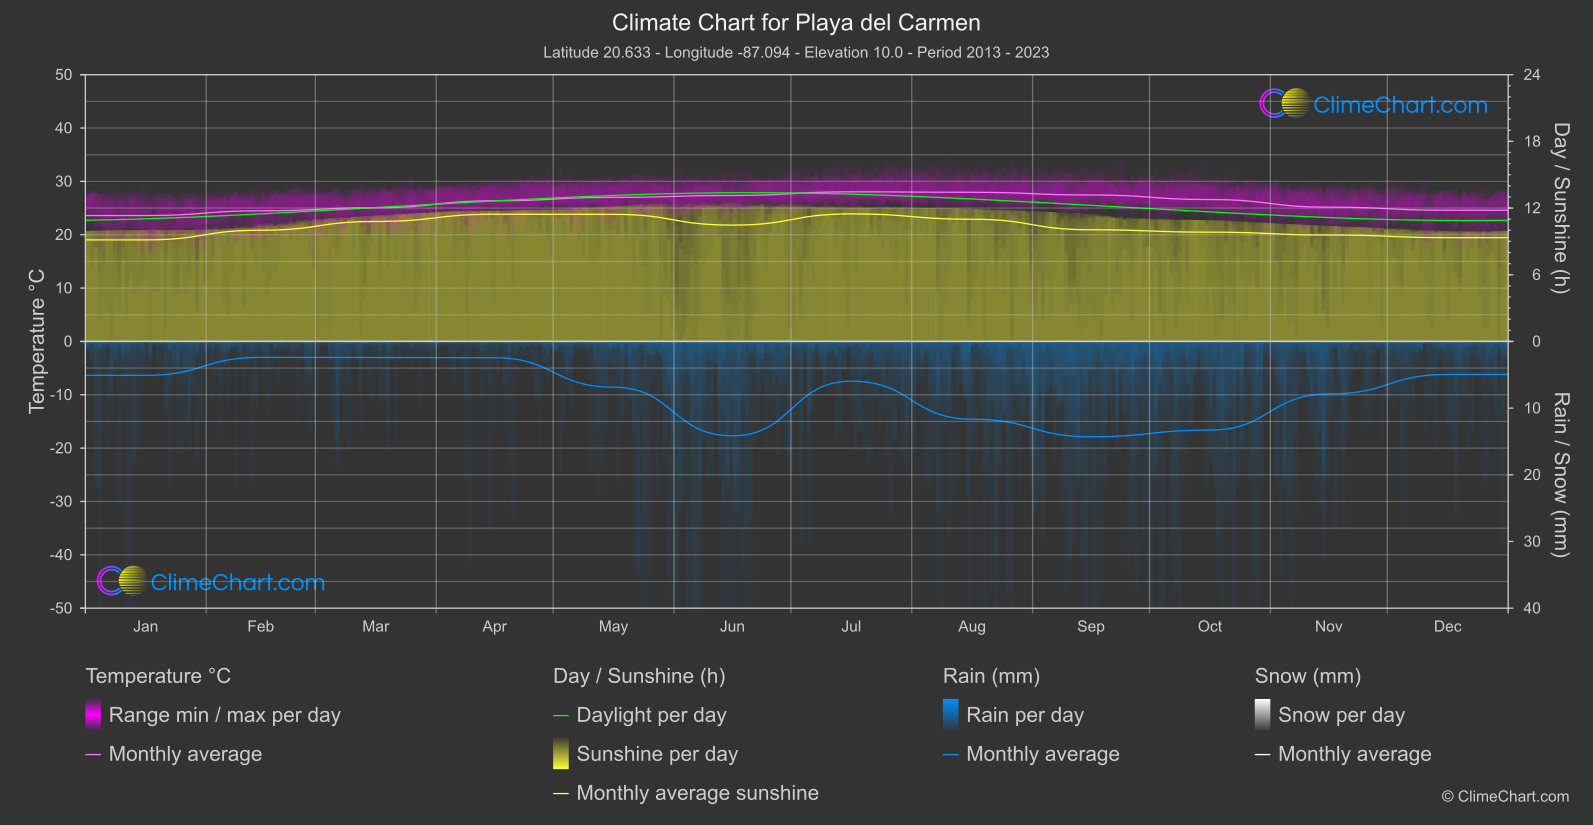
Playa del Carmen, located along the Caribbean Sea in the Riviera Maya region of Mexico, enjoys a tropical climate with warm temperatures year-round. The rainy season typically runs from June to October, with September being the wettest month. The dry season from November to May brings sunny days and lower humidity levels, making it an ideal time to visit.
Best Travel Time Guide for Playa del Carmen, Mexico: Ideal Seasons and Weather Insights
The best time to visit Playa del Carmen is during the dry season from November to May when you can enjoy sunny days and lower humidity. This period offers ideal beach weather and is perfect for outdoor activities and exploring the region.
Climate Data Overview for Playa del Carmen, Mexico
Explore the comprehensive climate data for Playa del Carmen, Mexico. This detailed table provides valuable insights into temperature variations, precipitation levels, and seasonal changes, helping you understand the unique weather patterns of this region.
| Month | ⌀ Temperature °C | ⌀ Rain (mm) | ⌀ Snow (mm) | ⌀ Sunshine (h) |
|---|---|---|---|---|
| Jan | 23.6 | 2.54 | 0.00 | 9.14 |
| Feb | 24.5 | 1.20 | 0.00 | 10.00 |
| Mar | 25.1 | 1.21 | 0.00 | 10.79 |
| Apr | 26.4 | 1.22 | 0.00 | 11.45 |
| May | 27.0 | 3.43 | 0.00 | 11.43 |
| Jun | 27.4 | 7.08 | 0.00 | 10.47 |
| Jul | 28.0 | 2.98 | 0.00 | 11.47 |
| Aug | 28.0 | 5.83 | 0.00 | 10.99 |
| Sep | 27.5 | 7.15 | 0.00 | 10.04 |
| Oct | 26.6 | 6.65 | 0.00 | 9.83 |
| Nov | 25.2 | 3.94 | 0.00 | 9.58 |
| Dec | 24.6 | 2.47 | 0.00 | 9.34 |
| ⌀ Month | 26.2 | 3.81 | 0.00 | 10.38 |