Climate Change Chart of Playa del Carmen, Mexico
Comprehensive Climate Change Chart of Playa del Carmen, Mexico: Monthly Averages and Impact Trends
Explore the changing climate in Playa del Carmen, Mexico, with insights on temperature, rainfall, and sunshine duration over the years.
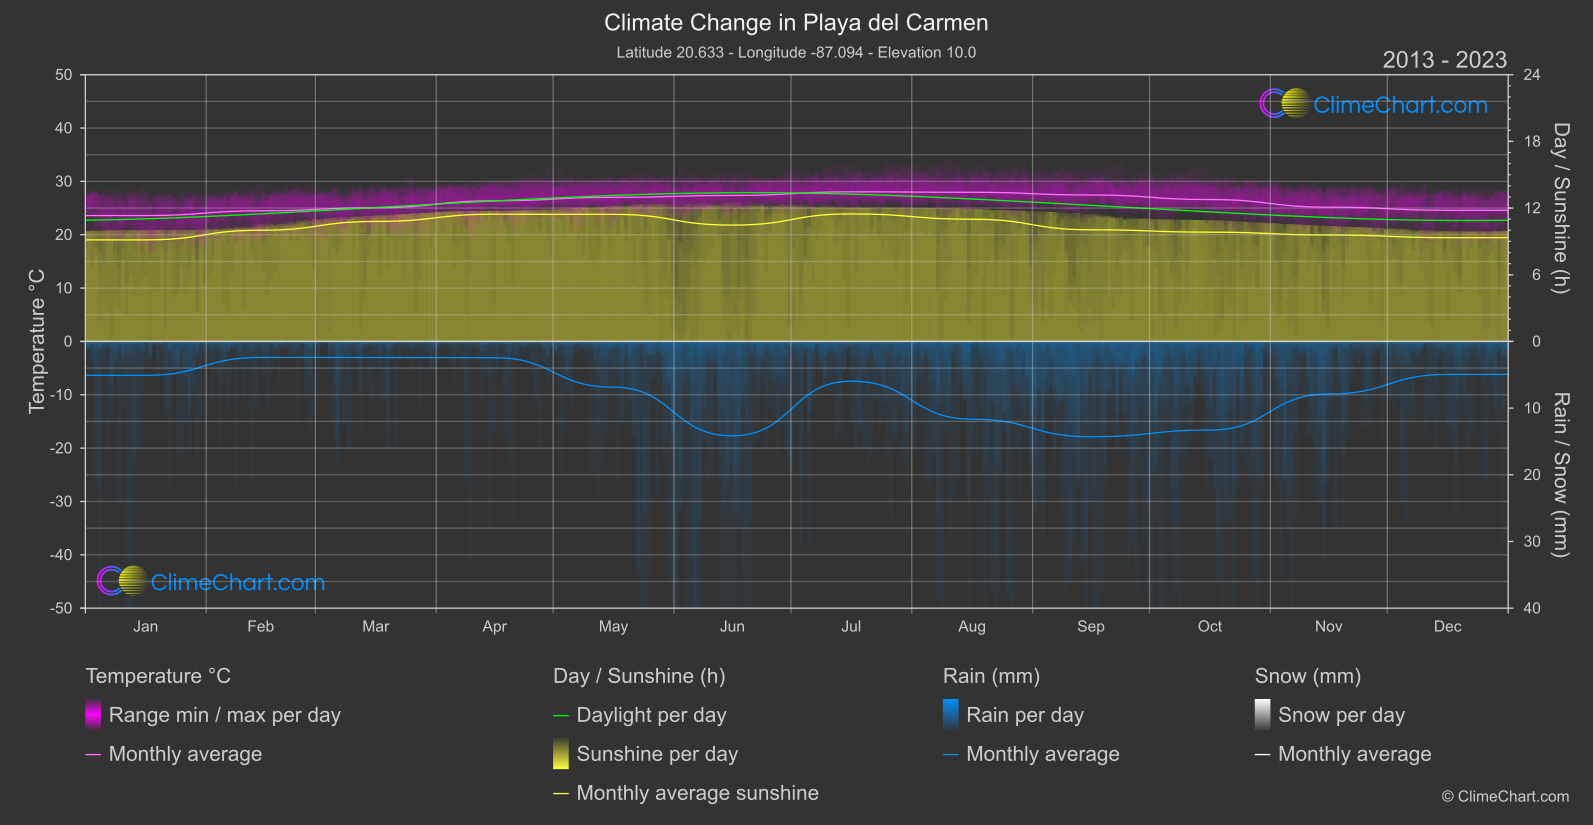
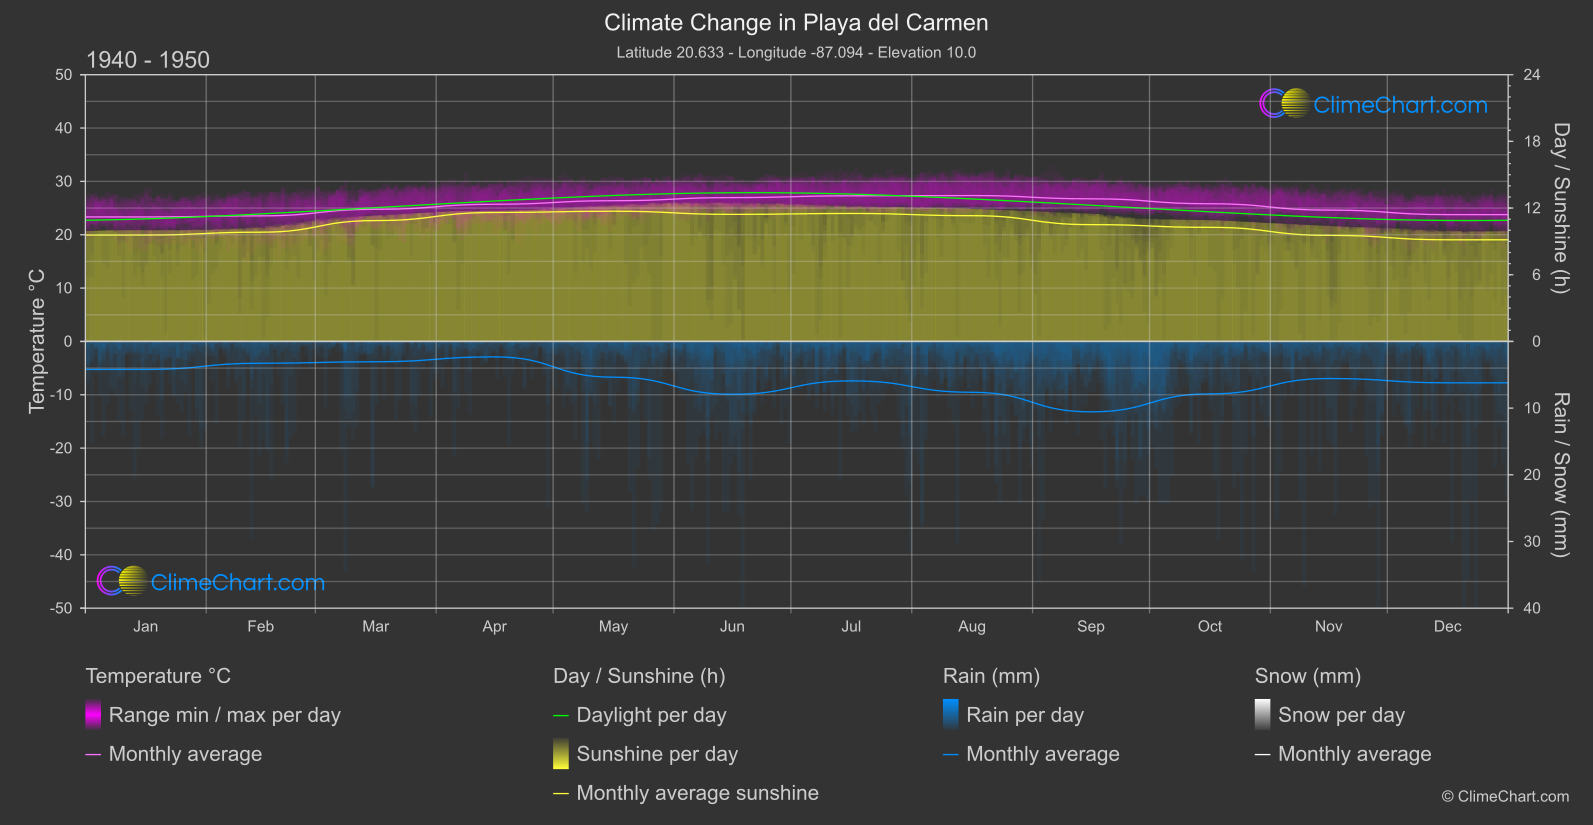
Learn about the climate and weather patterns in Playa del Carmen, Mexico, by comparing temperature, rainfall, and sunshine duration between the periods of 1940 - 1950 and 2013 - 2024. The data reveals interesting insights, such as the month with the highest temperature change or rainfall fluctuation. Discover how climate change is impacting this beautiful coastal city.
Climate Change Data Overview for Playa del Carmen, Mexico
Explore the comprehensive climate change data for Playa del Carmen, Mexico. This detailed table provides valuable insights into temperature variations, precipitation levels, and seasonal changes influenced by climate change, helping you understand the unique weather patterns of this region.
Temperature °C
| Month | ⌀ 1940 - 1950 | ⌀ 2013 - 2023 | +/- |
|---|---|---|---|
| Jan | 23.34 | 23.60 | 0.26 |
| Feb | 23.54 | 24.48 | 0.95 |
| Mar | 24.76 | 25.06 | 0.30 |
| Apr | 25.72 | 26.37 | 0.65 |
| May | 26.38 | 27.01 | 0.63 |
| Jun | 26.96 | 27.36 | 0.40 |
| Jul | 27.29 | 28.04 | 0.75 |
| Aug | 27.34 | 27.96 | 0.61 |
| Sep | 26.73 | 27.45 | 0.72 |
| Oct | 25.81 | 26.60 | 0.79 |
| Nov | 24.62 | 25.17 | 0.55 |
| Dec | 23.77 | 24.59 | 0.82 |
| ⌀ Month | 25.52 | 26.14 | 0.62 |
Sunshine (h)
| Month | ⌀ 1940 - 1950 | ⌀ 2013 - 2023 | +/- |
|---|---|---|---|
| Jan | 9.57 | 9.14 | -0.44 |
| Feb | 9.83 | 10.00 | 0.17 |
| Mar | 10.87 | 10.79 | -0.08 |
| Apr | 11.60 | 11.45 | -0.16 |
| May | 11.72 | 11.43 | -0.28 |
| Jun | 11.43 | 10.47 | -0.96 |
| Jul | 11.51 | 11.47 | -0.04 |
| Aug | 11.31 | 10.99 | -0.32 |
| Sep | 10.51 | 10.04 | -0.46 |
| Oct | 10.26 | 9.83 | -0.43 |
| Nov | 9.55 | 9.58 | 0.03 |
| Dec | 9.14 | 9.34 | 0.19 |
| ⌀ Month | 10.61 | 10.38 | -0.23 |
Rain (mm)
| Month | ⌀ 1940 - 1950 | ⌀ 2013 - 2023 | +/- |
|---|---|---|---|
| Jan | 2.10 | 2.54 | 0.44 |
| Feb | 1.64 | 1.20 | -0.44 |
| Mar | 1.52 | 1.21 | -0.32 |
| Apr | 1.16 | 1.22 | 0.07 |
| May | 2.68 | 3.43 | 0.75 |
| Jun | 3.96 | 7.08 | 3.11 |
| Jul | 2.96 | 2.98 | 0.02 |
| Aug | 3.81 | 5.83 | 2.02 |
| Sep | 5.28 | 7.15 | 1.87 |
| Oct | 3.93 | 6.65 | 2.71 |
| Nov | 2.78 | 3.94 | 1.16 |
| Dec | 3.10 | 2.47 | -0.63 |
| ⌀ Month | 2.91 | 3.81 | 0.90 |
Snow (mm)
| Month | ⌀ 1940 - 1950 | ⌀ 2013 - 2023 | +/- |
|---|---|---|---|
| Jan | 0.00 | 0.00 | 0.00 |
| Feb | 0.00 | 0.00 | 0.00 |
| Mar | 0.00 | 0.00 | 0.00 |
| Apr | 0.00 | 0.00 | 0.00 |
| May | 0.00 | 0.00 | 0.00 |
| Jun | 0.00 | 0.00 | 0.00 |
| Jul | 0.00 | 0.00 | 0.00 |
| Aug | 0.00 | 0.00 | 0.00 |
| Sep | 0.00 | 0.00 | 0.00 |
| Oct | 0.00 | 0.00 | 0.00 |
| Nov | 0.00 | 0.00 | 0.00 |
| Dec | 0.00 | 0.00 | 0.00 |
| ⌀ Month | 0.00 | 0.00 | 0.00 |