Climate Change Chart of Qingdao, China
Comprehensive Climate Change Chart of Qingdao, China: Monthly Averages and Impact Trends
Explore the changing climate in Qingdao, China through in-depth analysis of temperature, rainfall, snowfall, and sunshine duration data.
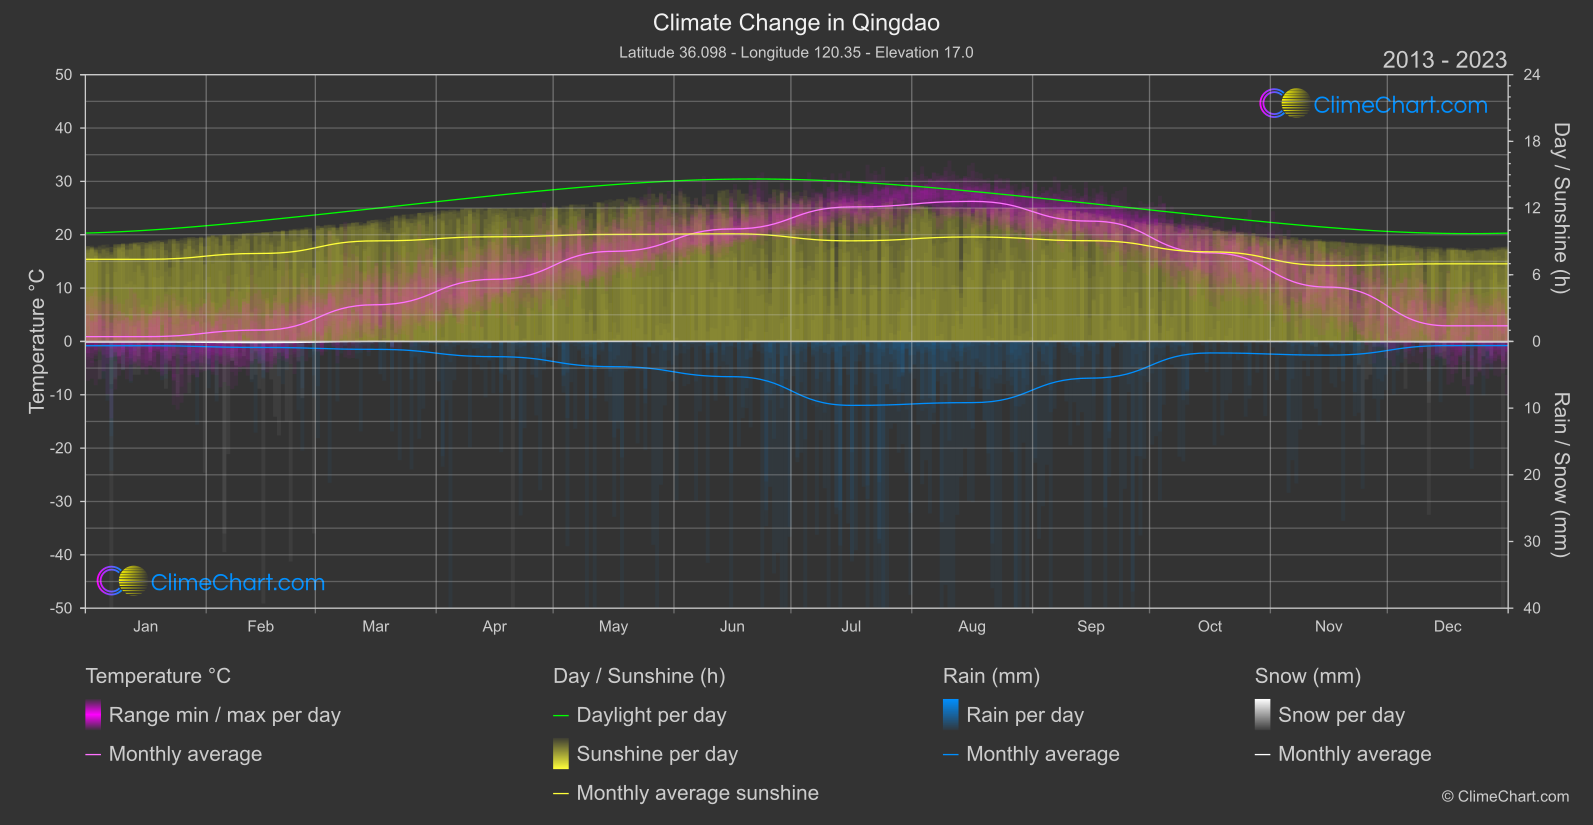
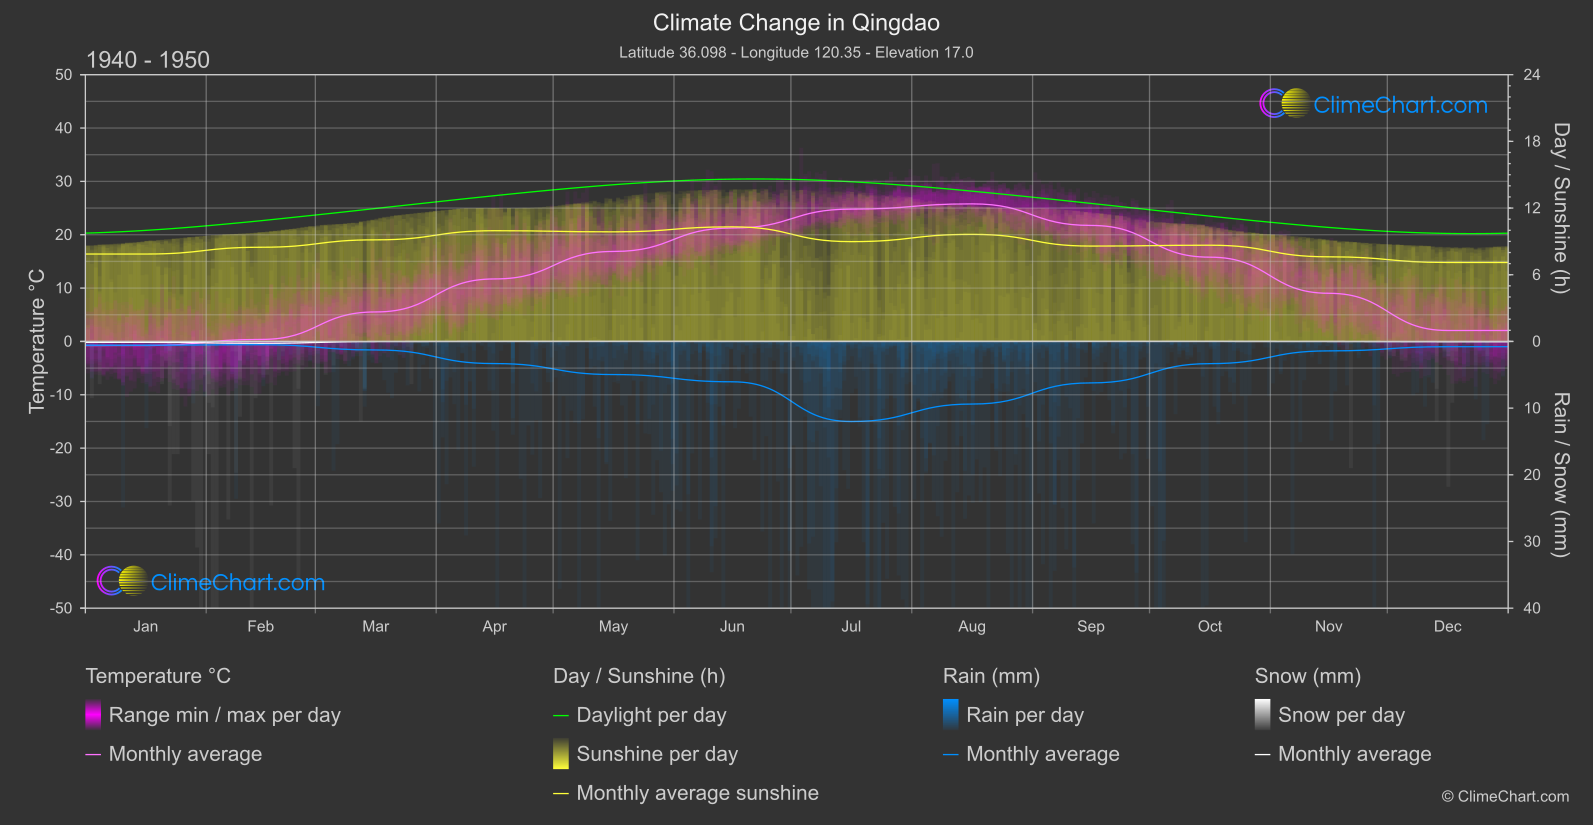
Qingdao, located in China, is experiencing noticeable changes in its climate. From temperature fluctuations to alterations in rainfall patterns, the city is witnessing shifts in weather conditions. Analyzing the data from the 1940s to the 1950s compared to 2013 to 2024 reveals interesting insights. For instance, the month with the highest temperature change is November, with a significant increase. On the other hand, the month with the most substantial decrease in snowfall is April. These changes indicate a shifting climate trend in Qingdao.
Climate Change Data Overview for Qingdao, China
Explore the comprehensive climate change data for Qingdao, China. This detailed table provides valuable insights into temperature variations, precipitation levels, and seasonal changes influenced by climate change, helping you understand the unique weather patterns of this region.
Temperature °C
| Month | ⌀ 1940 - 1950 | ⌀ 2013 - 2023 | +/- |
|---|---|---|---|
| Jan | -0.77 | 0.90 | 1.67 |
| Feb | 0.37 | 2.13 | 1.76 |
| Mar | 5.53 | 6.88 | 1.35 |
| Apr | 11.71 | 11.64 | -0.07 |
| May | 16.87 | 16.89 | 0.02 |
| Jun | 21.26 | 21.08 | -0.18 |
| Jul | 24.80 | 25.21 | 0.41 |
| Aug | 25.78 | 26.26 | 0.47 |
| Sep | 21.74 | 22.55 | 0.81 |
| Oct | 15.79 | 16.60 | 0.81 |
| Nov | 9.02 | 10.17 | 1.15 |
| Dec | 2.05 | 2.93 | 0.88 |
| ⌀ Month | 12.85 | 13.60 | 0.76 |
Sunshine (h)
| Month | ⌀ 1940 - 1950 | ⌀ 2013 - 2023 | +/- |
|---|---|---|---|
| Jan | 7.86 | 7.39 | -0.47 |
| Feb | 8.47 | 7.92 | -0.56 |
| Mar | 9.14 | 9.05 | -0.09 |
| Apr | 9.96 | 9.42 | -0.55 |
| May | 9.86 | 9.63 | -0.23 |
| Jun | 10.31 | 9.68 | -0.63 |
| Jul | 8.98 | 9.05 | 0.07 |
| Aug | 9.63 | 9.40 | -0.23 |
| Sep | 8.58 | 9.06 | 0.48 |
| Oct | 8.66 | 8.06 | -0.60 |
| Nov | 7.61 | 6.83 | -0.78 |
| Dec | 7.10 | 6.98 | -0.12 |
| ⌀ Month | 8.85 | 8.54 | -0.31 |
Rain (mm)
| Month | ⌀ 1940 - 1950 | ⌀ 2013 - 2023 | +/- |
|---|---|---|---|
| Jan | 0.28 | 0.32 | 0.04 |
| Feb | 0.25 | 0.45 | 0.21 |
| Mar | 0.64 | 0.59 | -0.05 |
| Apr | 1.66 | 1.14 | -0.52 |
| May | 2.48 | 1.89 | -0.59 |
| Jun | 3.03 | 2.64 | -0.38 |
| Jul | 6.01 | 4.79 | -1.21 |
| Aug | 4.70 | 4.59 | -0.11 |
| Sep | 3.11 | 2.75 | -0.36 |
| Oct | 1.67 | 0.86 | -0.80 |
| Nov | 0.71 | 1.03 | 0.32 |
| Dec | 0.39 | 0.31 | -0.08 |
| ⌀ Month | 2.08 | 1.78 | -0.30 |
Snow (mm)
| Month | ⌀ 1940 - 1950 | ⌀ 2013 - 2023 | +/- |
|---|---|---|---|
| Jan | 0.07 | 0.05 | -0.02 |
| Feb | 0.14 | 0.09 | -0.05 |
| Mar | 0.01 | 0.00 | -0.01 |
| Apr | 0.00 | 0.01 | 0.01 |
| May | 0.00 | 0.00 | 0.00 |
| Jun | 0.00 | 0.00 | 0.00 |
| Jul | 0.00 | 0.00 | 0.00 |
| Aug | 0.00 | 0.00 | 0.00 |
| Sep | 0.00 | 0.00 | 0.00 |
| Oct | 0.00 | 0.00 | 0.00 |
| Nov | 0.01 | 0.01 | 0.00 |
| Dec | 0.02 | 0.03 | 0.01 |
| ⌀ Month | 0.02 | 0.02 | -0.00 |